Example Gallery
click the images to visit the corresponding example page
Tracking synthesis by RNA polymerase as it moves along DNA
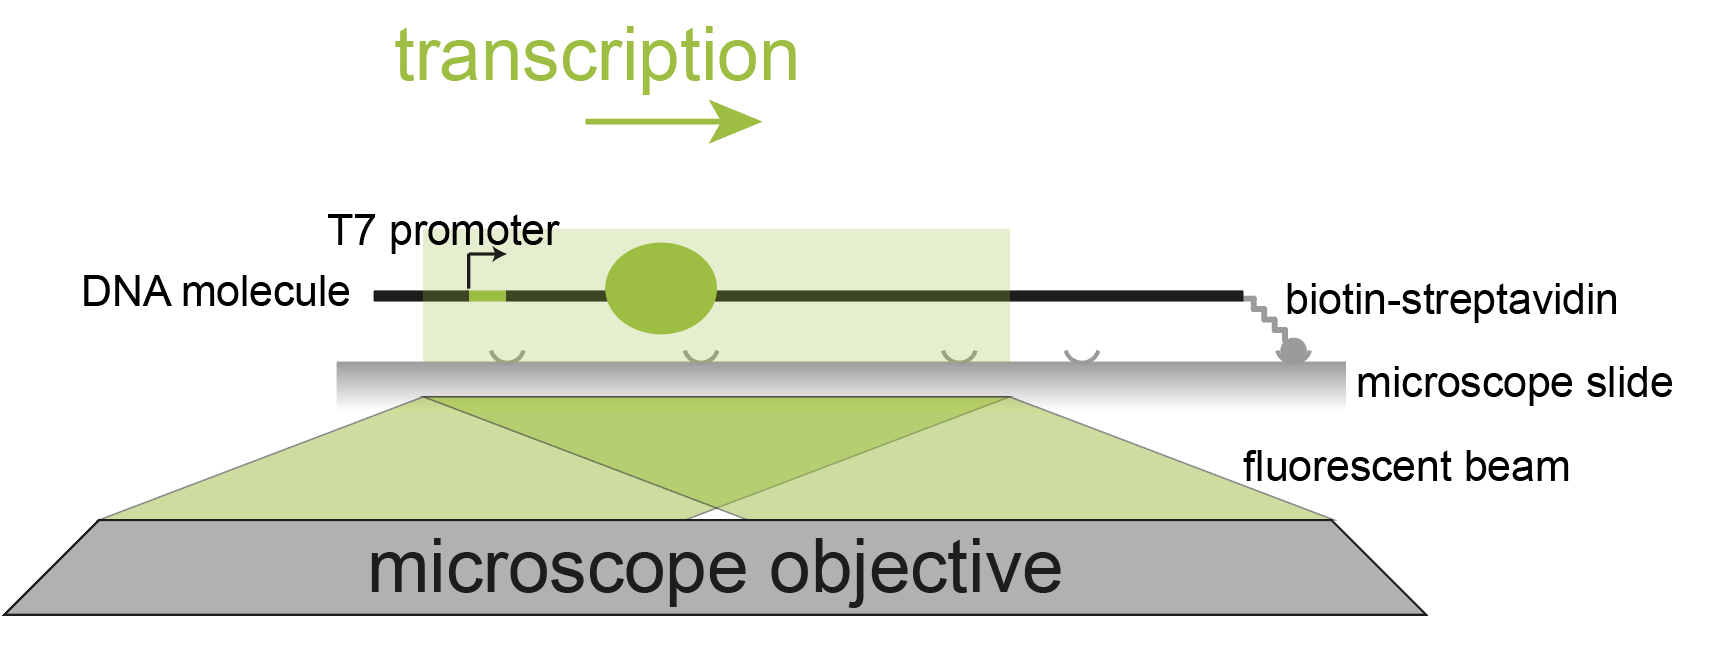
Workflow for tracking and analyzing polymerase movement on DNA molecules. (Scherr et al., 2022, Cell Reports)
Static FRET
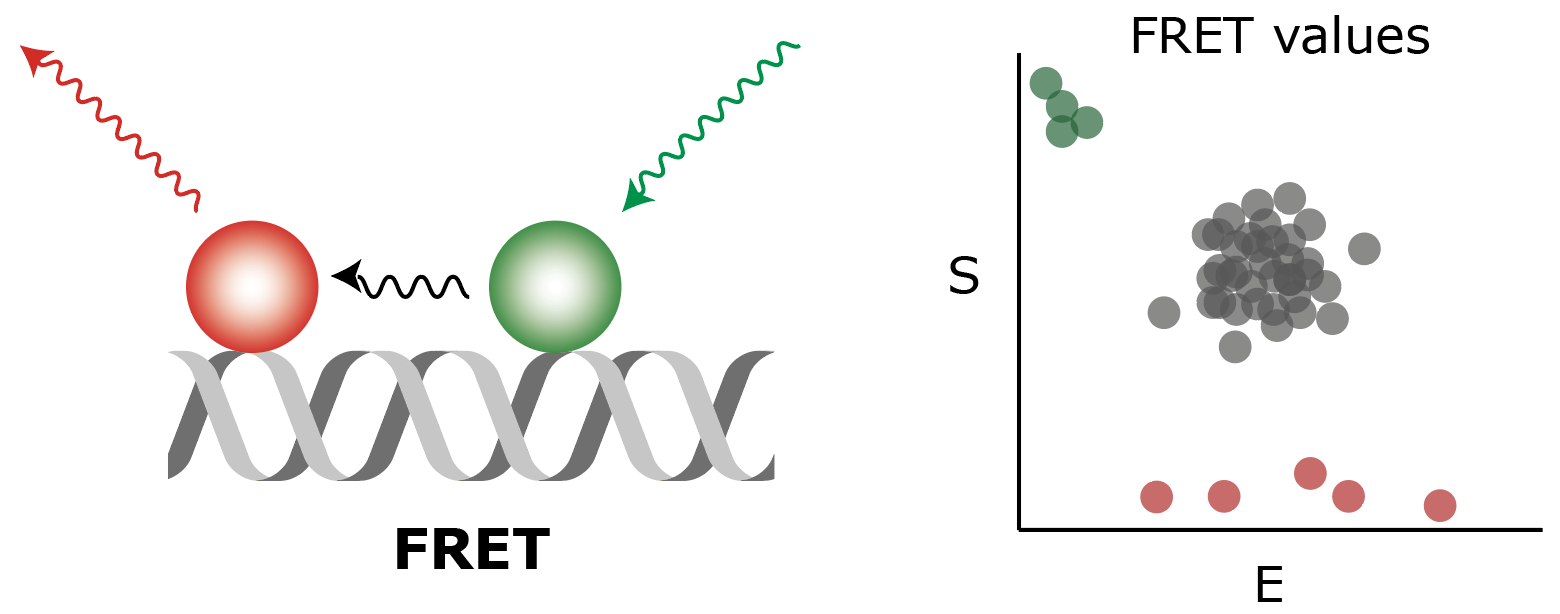
Workflow for processing static single-molecule FRET from short duplex DNA molecules with donor and acceptor fluorophores positioned at two fixed distances apart as described by Hellenkamp et al., 2018, Nat. Meth.. To allow for benchmarking, publicly available sample data from Hellenkamp et al. were used and their ALEX analysis strategy was adapted into the Mars workflow.
Dynamic FRET
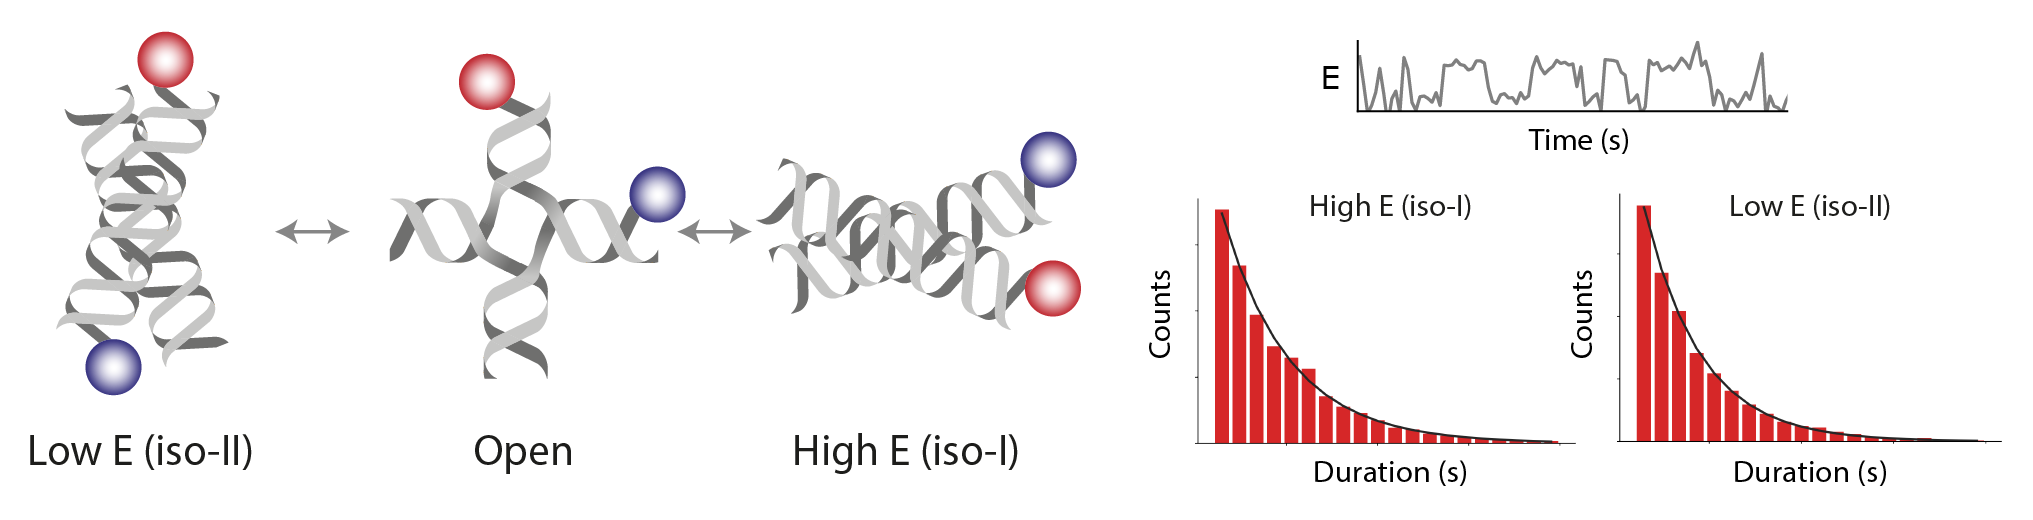
Workflow for processing dynamic single-molecule FRET from a Holliday junction functionalized with donor and acceptor fluorophores positioned on different DNA arms following the design of Hyeon et al., 2012, Nat. Chem. New sample data were collected for this Mars workflow using an Alternating Laser EXcitation (ALEX) strategy.
There are two example workflows using the Holliday junction sample data. In the first dynamic FRET example workflow, both the direct acceptor excitation (637, C=0) and FRET (532, C=1) information is used to generate fully corrected E and S distributions closely following the analysis protocol from Hellenkamp et al., 2018, Nat. Meth.. In the second dynamic FRET example workflow, only the FRET (532, C=1) information is used to generate a corrected E distribution following the analysis protocol from McCann et al.. The direct acceptor excitation information is integrated in the first steps of the second dynamic FRET example workflow for visual inspection purposes only. Therefore, the second dynamic FRET example workflow illustrates how to analyze FRET datasets containing no direct acceptor excitation information.
Flow Magnetic Tweezers
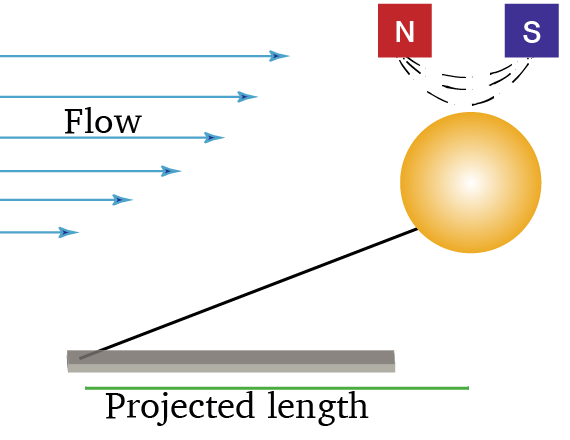
Workflow for tracking and processing the motion of paramagnetic beads attached to DNA molecules and manipulated by Flow Magnetic Tweezers. (Agarwal & Duderstadt, 2020, Nat. Comm.)
Short Script Examples
1. Plot the Kinetic Change Point Rates with Python
Jupyter notebook showing how to retrieve the segment tables in a Python environment and how to plot the calculated rates with seaborn as well as in the Rover scriptable widgets.
2. Generate a Table of Parameter Values from the Archive
Groovy script to make a MarsTable showing the value for the specified parameter for each molecule entry. Run the script and a pop-up dialog will be created in which the parameter of interest can be selected.
More example scripts can be found in the git repository. Please visit the Mars Java docs for more information about all classes and individual commands.