Molecules
The Molecules tab has three main sections:
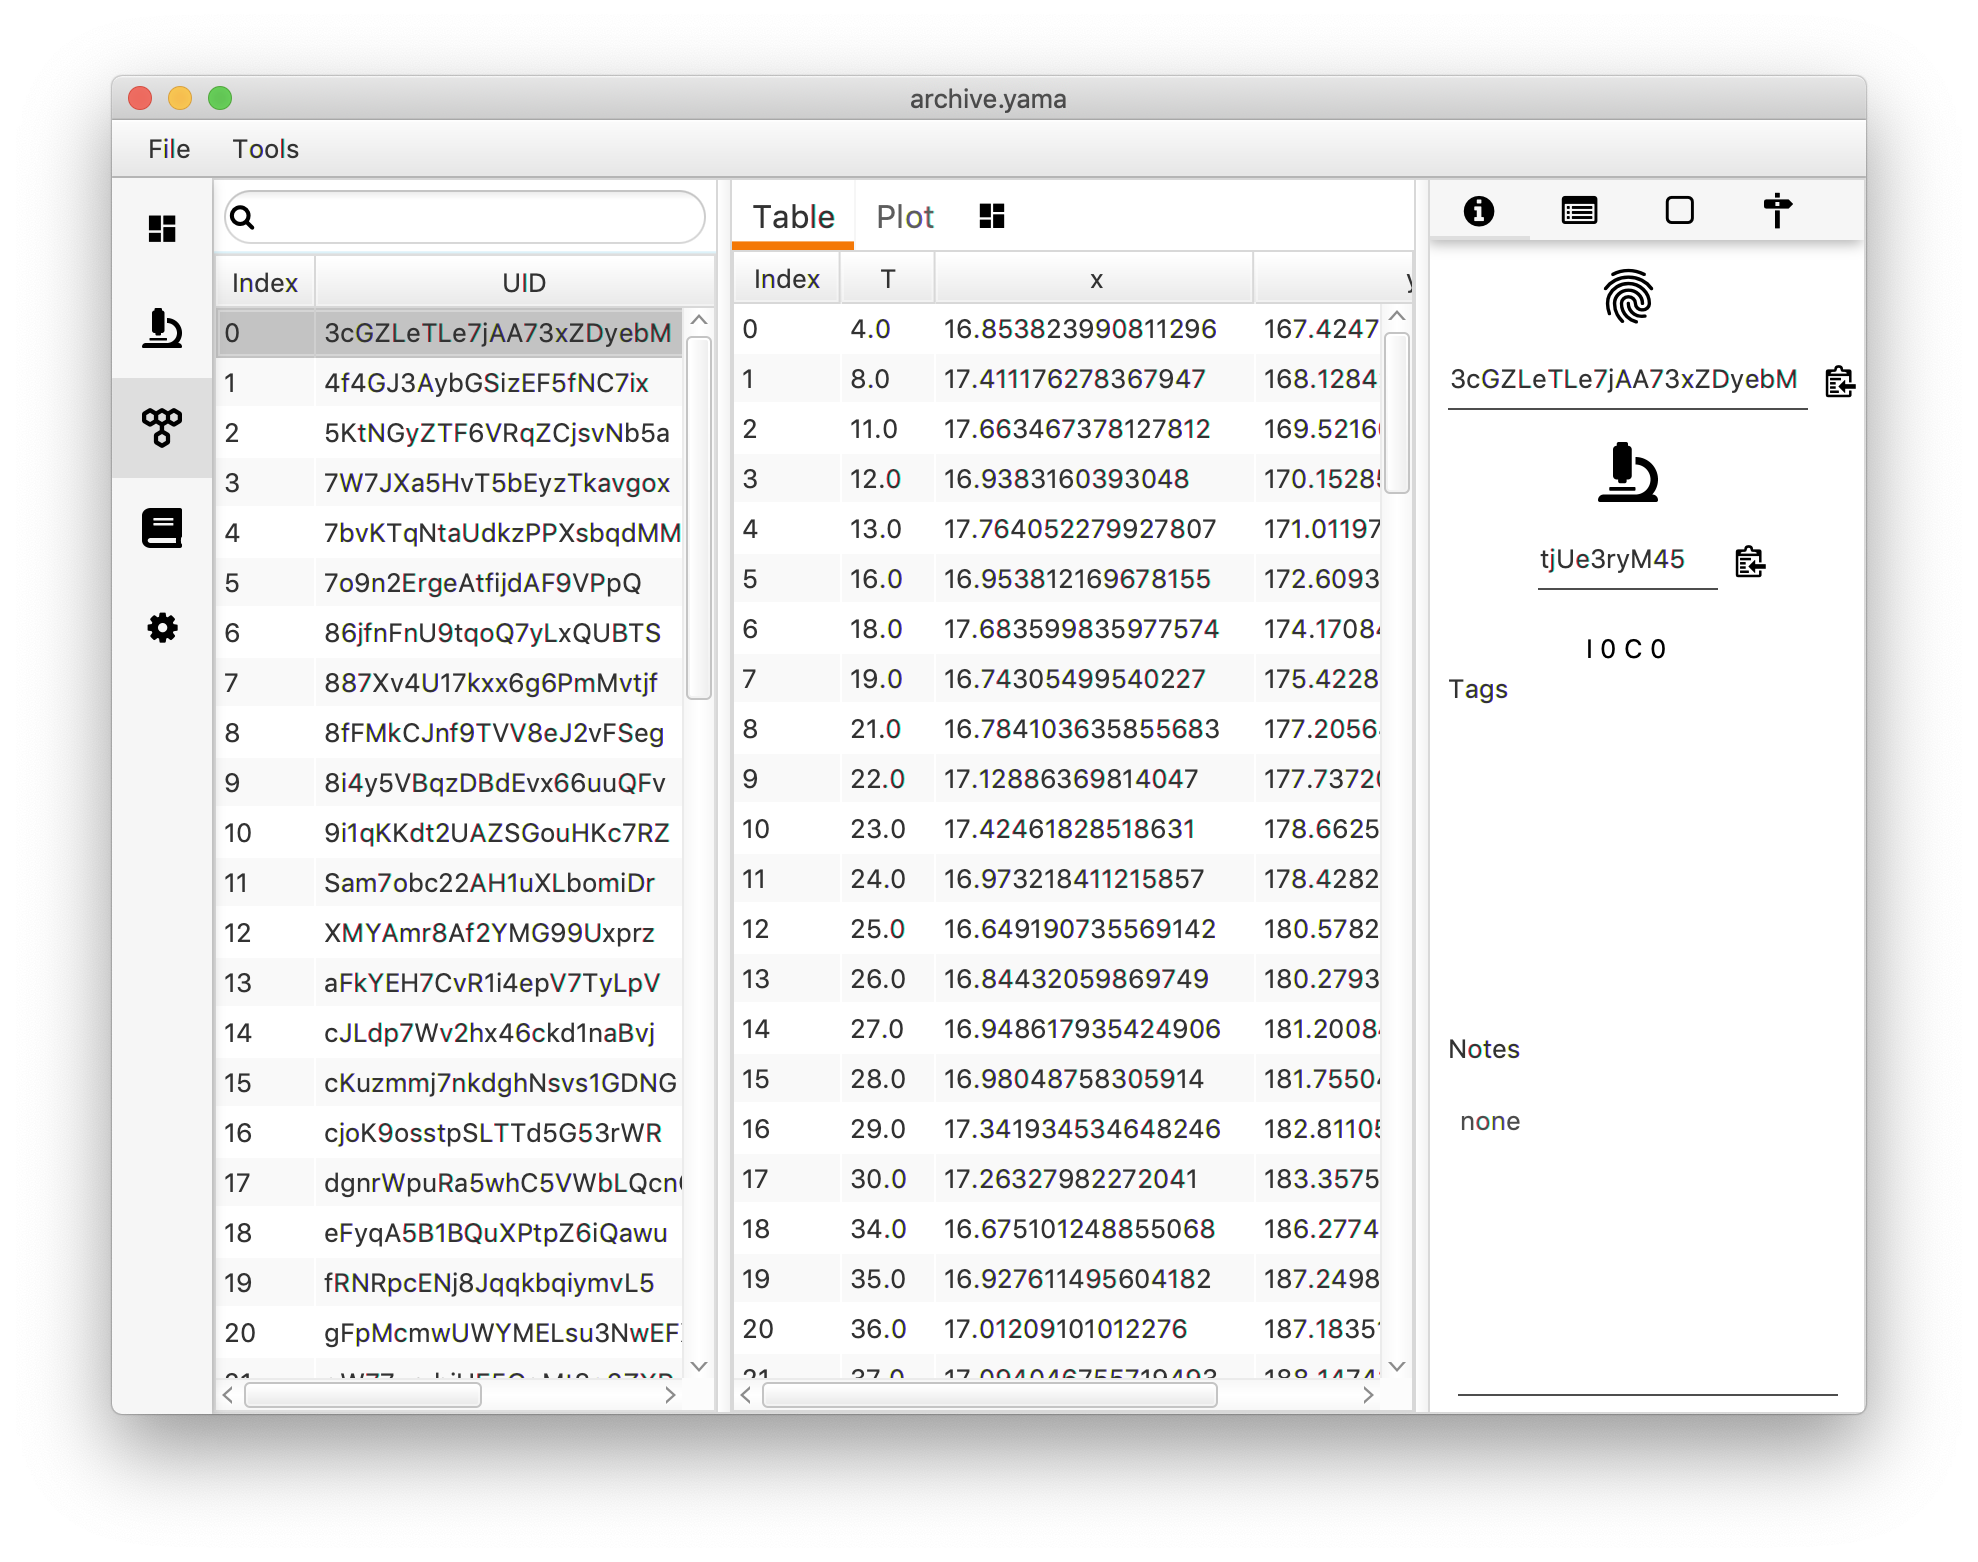
1. List of molecules in the Archive.
| Index | Index of the molecule. |
| UID | UID of the molecule. |
| Tags | Tags given to the molecule. |
| metaUID | UID of the experiment. |
2. Data section.
| Table | Molecule specific position information (x, y, intensity, slice). |
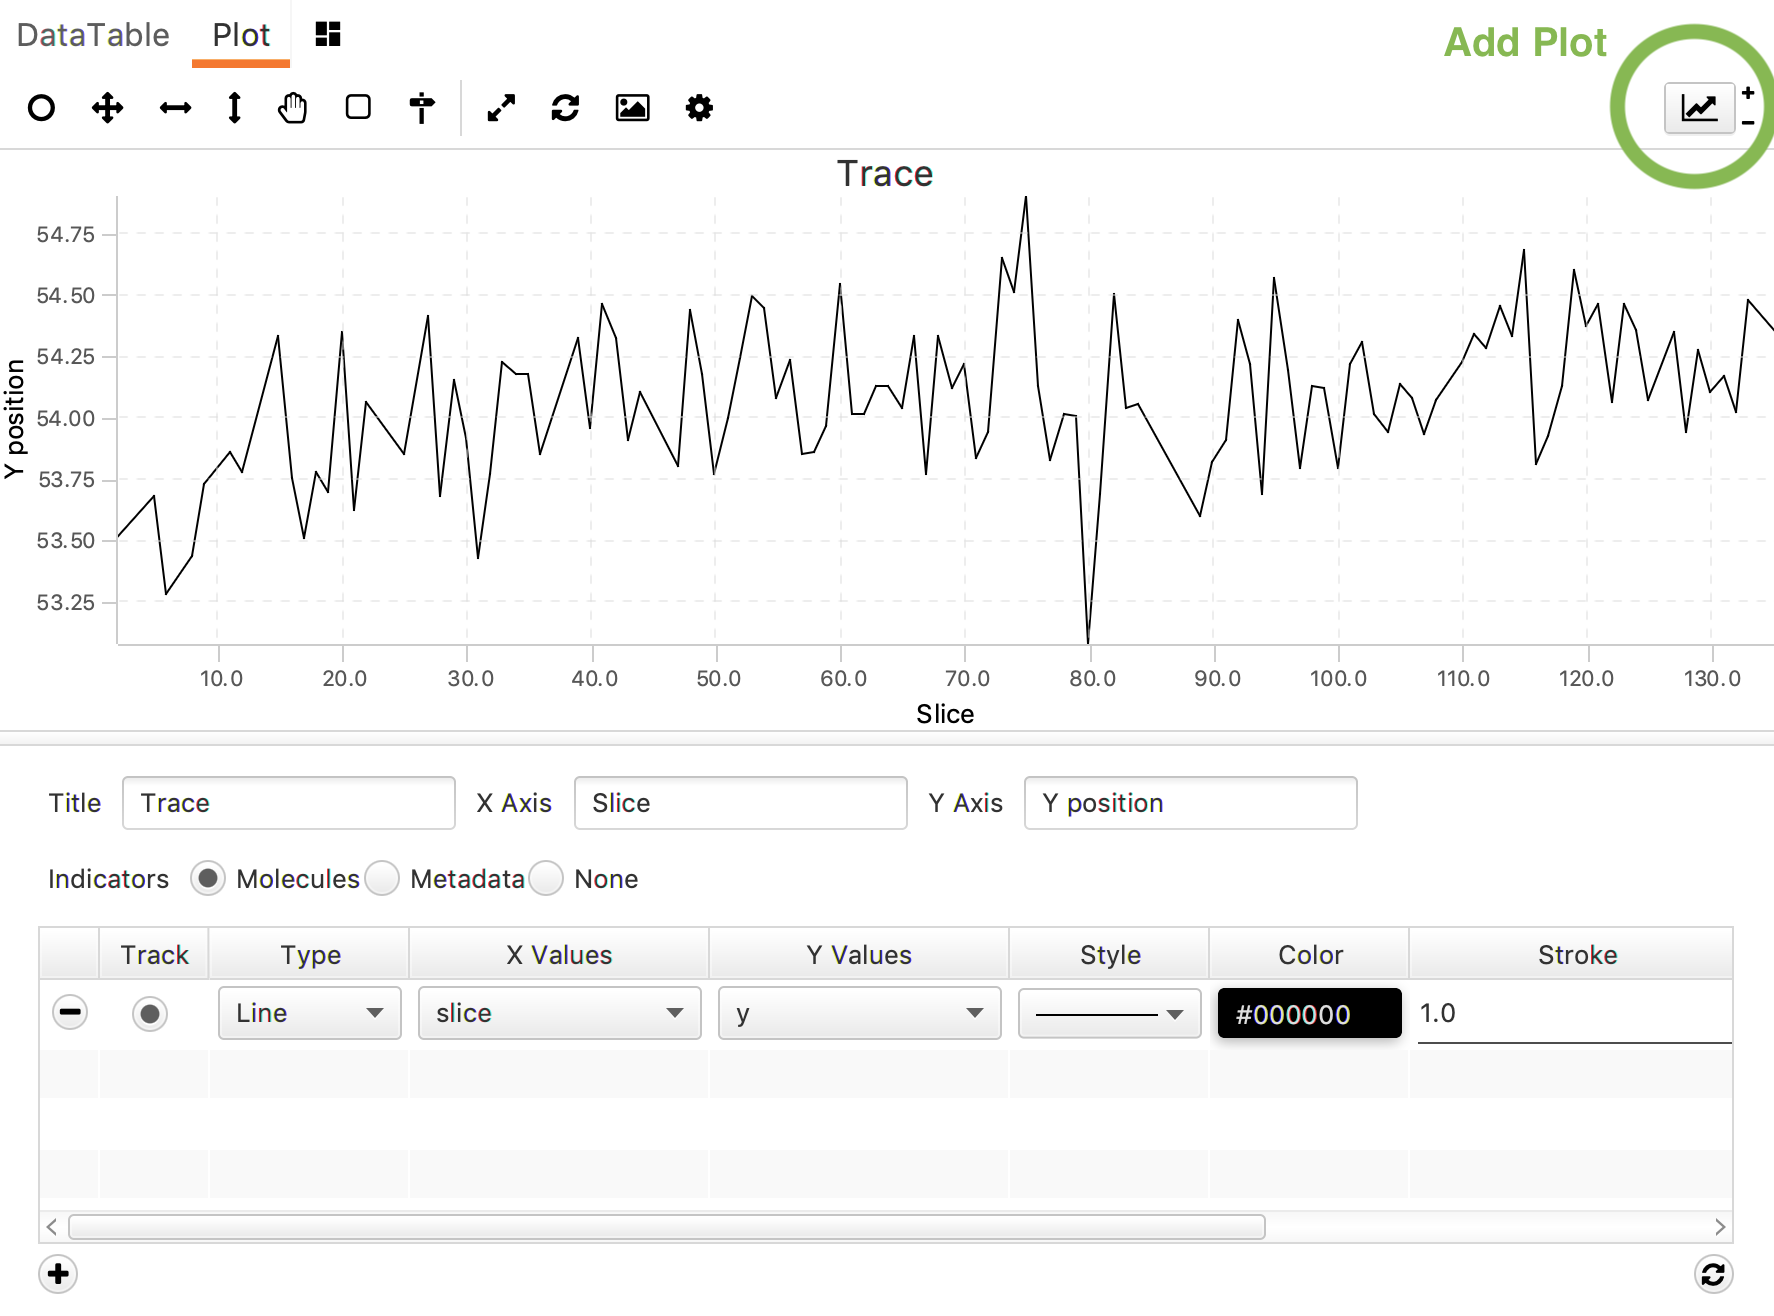
| Plot | Plotting widget for easy in-GUI analysis of the data. |
| Scriptable widgets | Scriptable widgets to visualise data per molecule. |
Plotting: To make a plot press the ‘Add Plot’ button. A new window will appear at the bottom of the screen to provide title, axis labels, indicators, x-value, y-value, style, color and stroke. Add an additional line by pressing the + in the left corner, update the graph with the refresh button in the right corner.
The plotting window itself can be formatted using the tools above the plot. From left to right: track tool (move over the graph to read the corresponding data values), select XY region, select X region, select Y region, move graph, set region, set position, reset zoom, reload graph, save image as .png, and settings (fix X and Y bounds, turn gridlines on/off).
3. Notes, parameters, and information per molecule.
| Information | UID (copy to clipboard with icon), metaUID, Channel information, Tags and Notes. |
| Parameters | List of parameters. Select the parameter type in the box and then type the parameter name. Parameter types: number (123), string (Aa) & Boolean (square) |
| Regions | List of assigned regions. |
| Positions | List of assigned positions. |