Scriptable Widgets

The scriptable widgets are available on Rover Dashboard and also in the ‘Metadata’ and ‘Molecules’ tabs. They allow for a rapid evaluation of the archive, metadata, and molecule features. All scriptable widgets leverage the scripting capabilities of ImageJ to provide limitless customisability. Scripts can be written in Python or Groovy. In both cases, chart scripts are provided with a single input that depends on the dashboard.
At the highest level, the global dashboard receives a reference to the entire Molecule Archive as an input. This provides complete access to all molecules, metadata, and properties, so global relationships can be rapidly evaluated. Dashboards are also provided within the ‘Metadata’ and ‘Molecules’ tabs. These receive Metadata and Molecule references for detailed inspection of individual records. Once a suitable collection of widgets has been setup, simply reloading after selecting different molecule and metadata records will update all charts in reference to the current record.
General setup of all Widgets
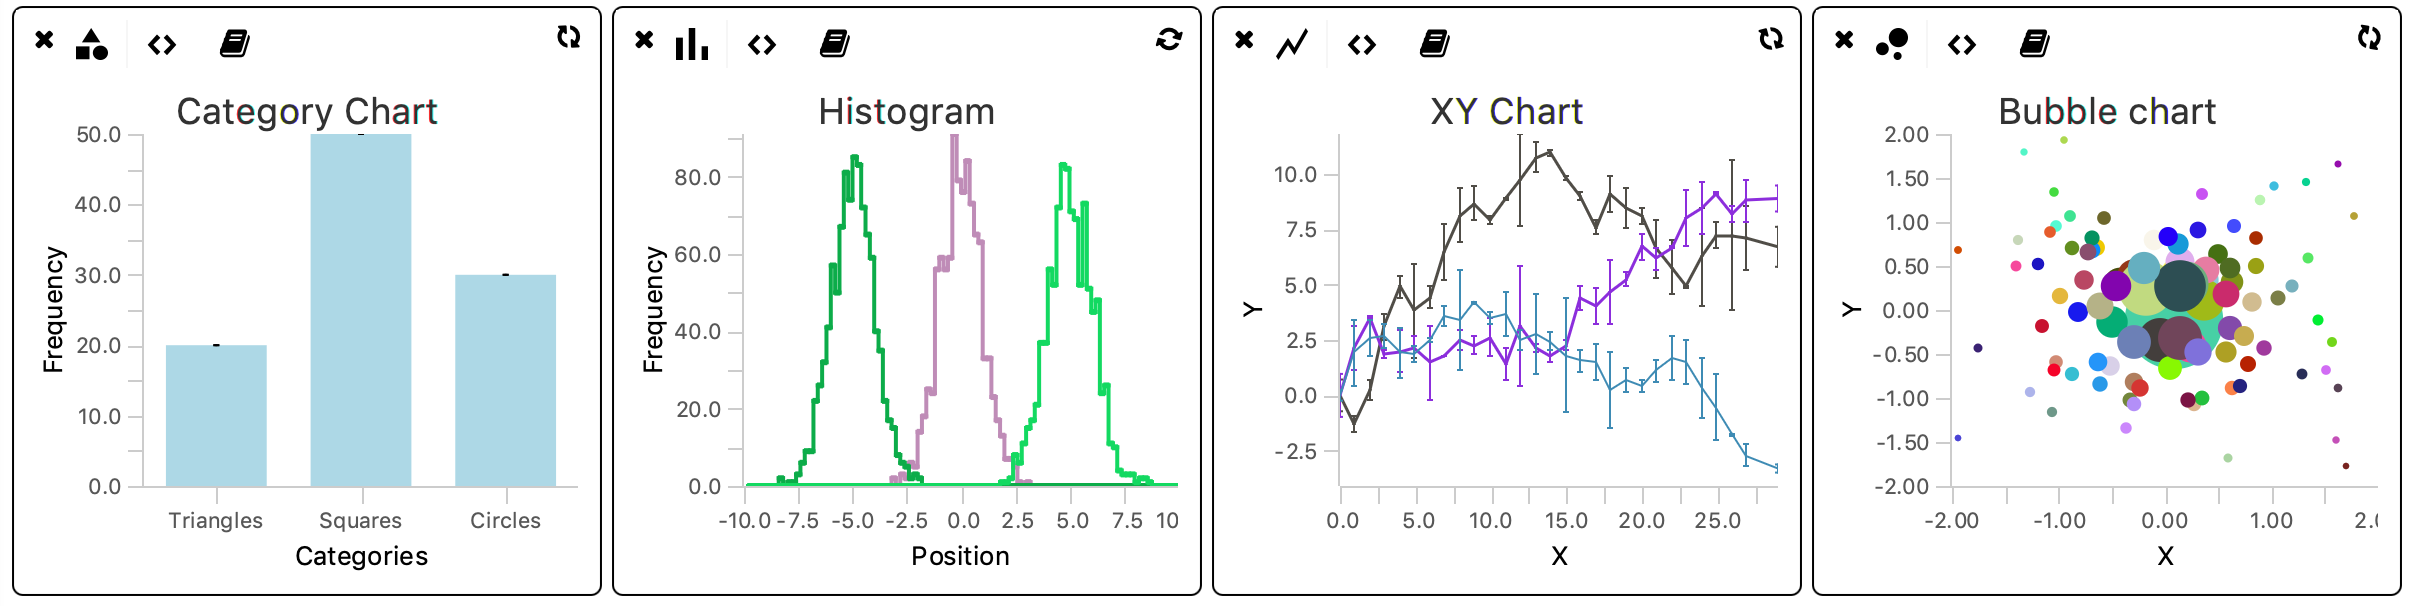
There are five types of widgets available in Mars:
- Category Chart
- Histogram
- XY Chart
- Bubble Chart
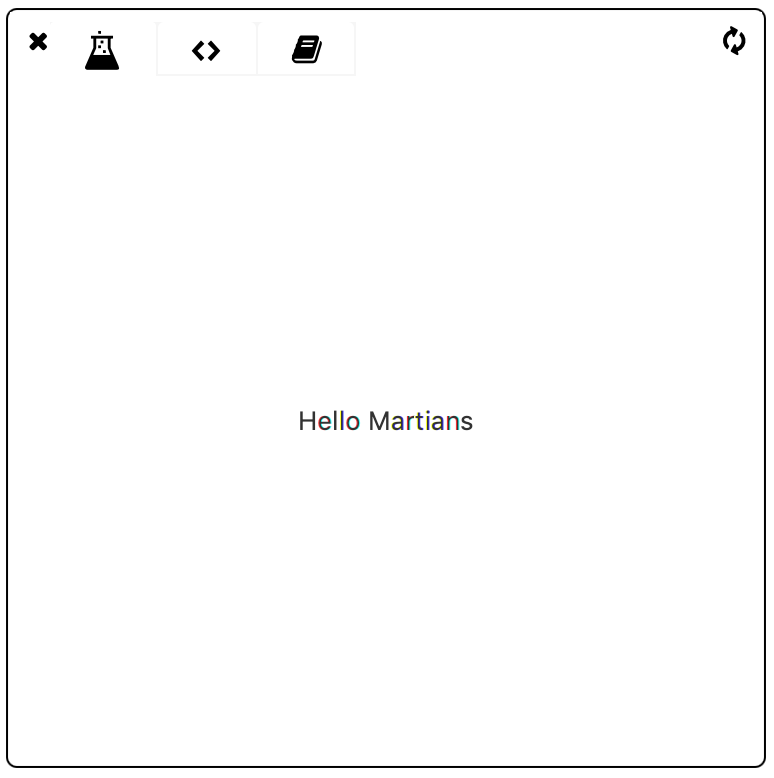
- Beaker
In all cases, the widget can be opened by clicking the corresponding icon. Click the icon multiple times to open multiple copies of the widget at the same time. The script can be altered in the scripting tab (<>) and the chart can be rendered by pressing the refresh icon. The script log can be accessed by pressing the book icon. This log holds all information about running the script (f.e. error types). By default, all widgets come with example code that render an example plot when pressing the refresh button. Widget-specific details are discussed in the next section.
Scripting
The entire scripting framework relies on the script parameter harvesting mechanism provided with ImageJ. This way of parameter handling ensures that multiple languages can be interpreted (in the case of Mars: Python & Groovy) and makes the scripts easily interchangeable between script running environments. An example Python script is discussed to highlight the main script features. More information on this specific example can be found at the histogram example in the ‘How to use Scriptable Widgets’ tutorial
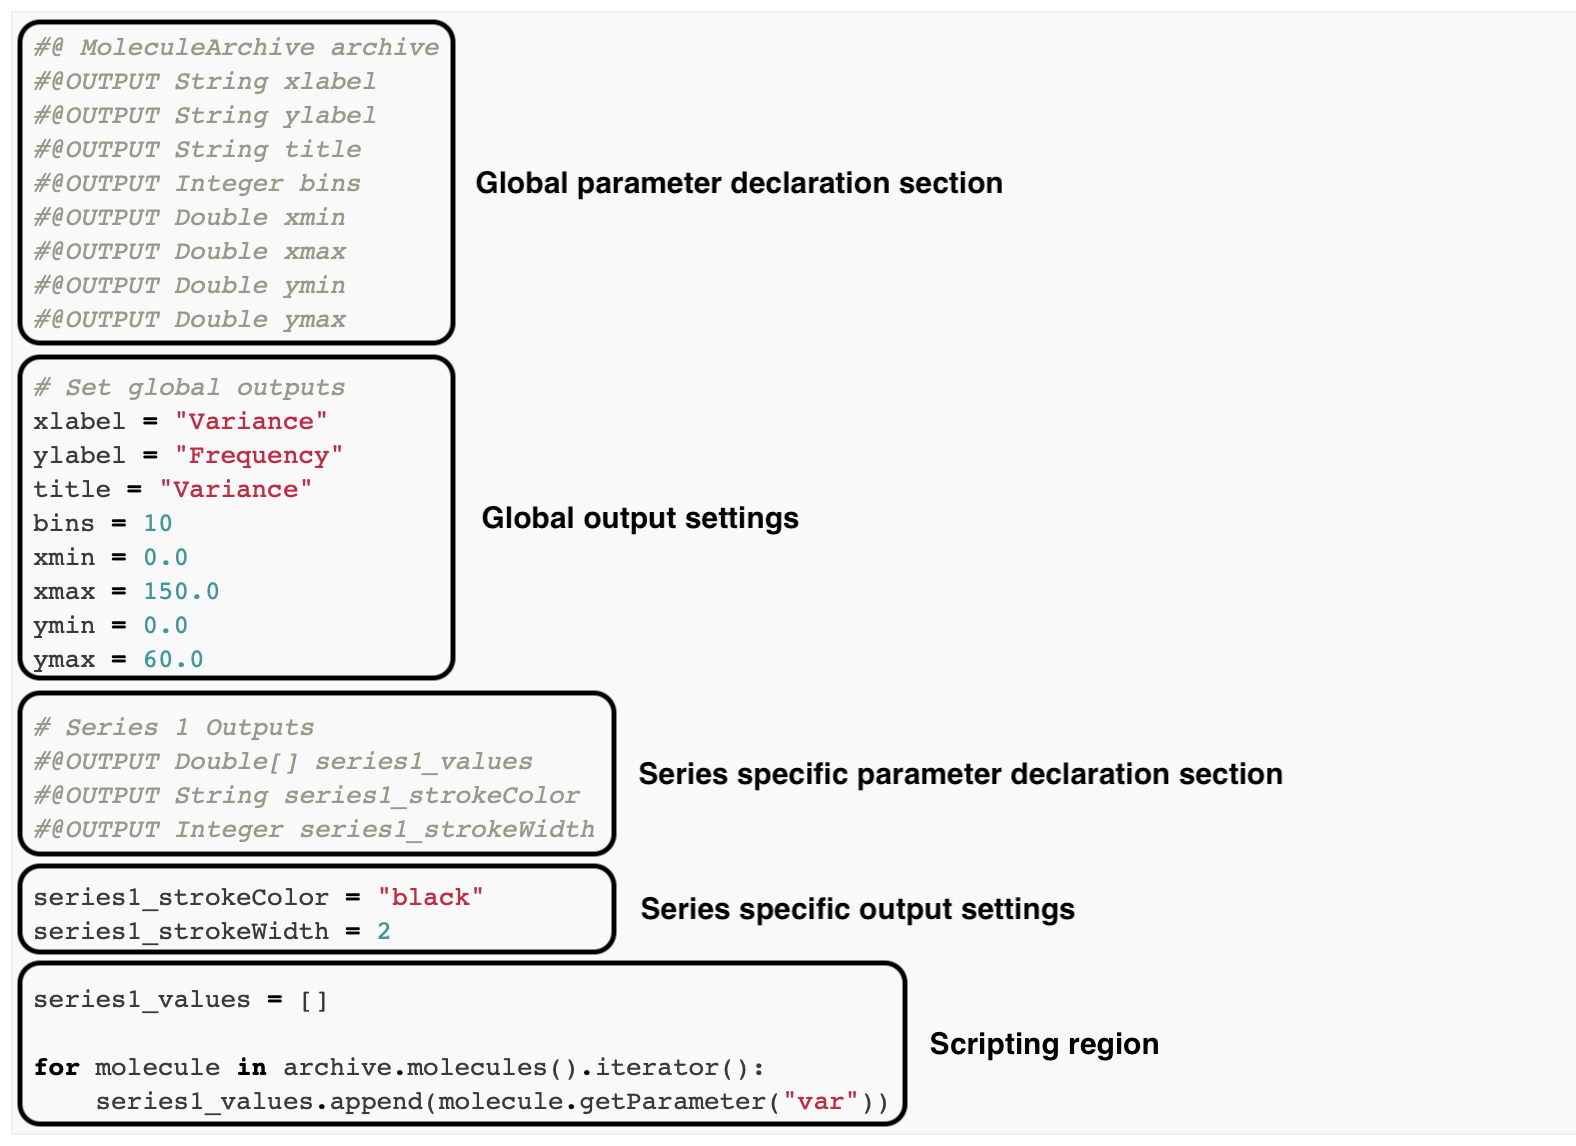
In general, a script contains the following sections:
- Global parameter declaration section: declare the input and outputs of the script using the script parameter syntax:
- #@ Type variableName declares an input
- #@OUTPUT Type variableName declares an output
- Global output settings: global settings like labels, title and axis information. Make sure that the data type provided corresponds with the expected data type set in the parameter declaration.
- Series specific parameter declaration: in this script each line in the plot is defined as a series# (where # is replaced by a number). Depending on the number of series shown, more or less parameters have to be declared. In this example only one line is plotted so only series1 parameters have to be declared.
- Series specific output settings: set series specific information such as in this case: color and strokewidth.
- Scripting region: script that retrieves the data of interest from the archive and converts it to the parameter used for plotting. In the case of this example the parameter ‘var’ is retrieved for each molecule and added to the list of series1_values. This list is plotted in the chart.
Note that the parameters always have to be declared before assigning them, but the order of the other components of the script is up to the preferences of the user. Variables used for scripting that are not used as a plot output do not need to be declared as parameter in the script.
To learn more about customising the scripts of the widgets please go to the How to use Scriptable Widgets tutorial.
Language details
The scripting environment is based on the environment provided by ImageJ. Language specific features can be found in the ImageJ documentation. Mars supports scripting in Python and Groovy.
Python
The Python version used within ImageJ, and therefore within Mars, is Jython. Jython forms a seamless interaction between Python and Java and allows the user to mix both languages during development. The Java implementation of Python is limited to the standard library of Python 2. It is not possible to use external python modules (f.e. Numpy, Pandas or Matplotlib), however, any Java class in the Fiji installation can be used.
Groovy
Groovy is a Java-based language that builds upon the strenghts of Java but has additional features inspired by languages like Python, Ruby and Smalltalk. For more information about scripting in Groovy visit the Groovy Quick Start guide.
Widget-specific information
For an example script for each plot type visit the How to use Scriptable Widgets tutorial page.
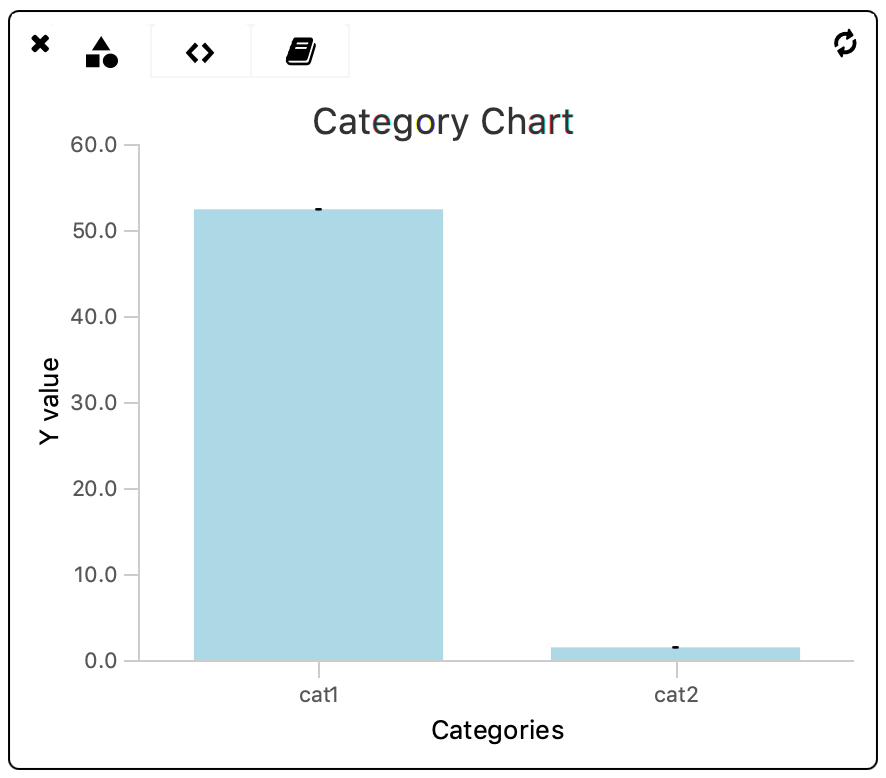
1. Category Chart
Expected Outputs
| xlabel | Label for the x axis |
| ylabel | Label for the y axis |
| color | Color of the bars |
| title | Plot title |
| xvalues | Category names |
| yvalues | Y values per category |
| ymin | Y-axis minimum |
| ymax | Y-axis maximum |
Adding Categories
To add additional categories to the plot add another category name to ‘xvalues’ and another value to ‘yvalues’. In case the number of xvalues does not correlate with the number of yvalues an error is returned in the script log.
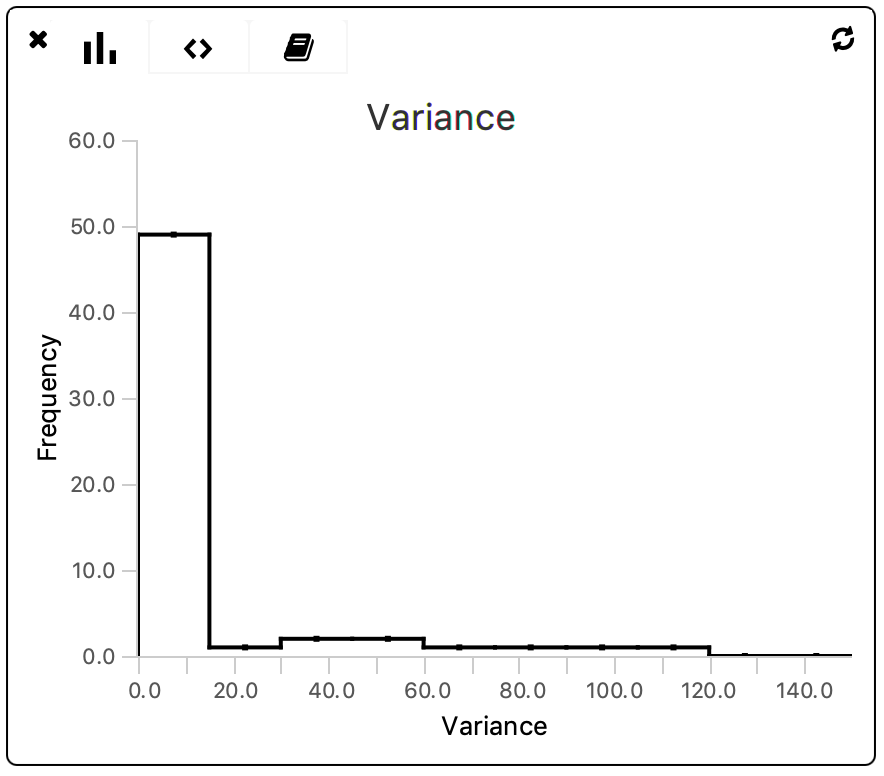
2. Histogram
Expected Outputs
| xlabel | Label for the x axis |
| ylabel | Label for the y axis |
| title | Plot title |
| bins | Number of bins to use in the histogram |
| xmin | X-axis minimum, at the same time the selection for the data range to incorporate |
| xmax | X-axis maximum, at the same time the selection for the data range to incorporate |
| ymin | Y-axis minimum |
| ymax | Y-axis maximum |
| series1_values | Values on which the histogram output is based |
| series1_strokeColor | Stroke color of the histogram |
| series1_strokeWidth | Stroke width of the histogram |
Note that by selecting xmin and xmax the range of data points to include in the histogram is set as well. This enables the selection of a region of interest. To make sure the full data range is covered use:
xmin = min(series1_values)
xmax = max(series1_values)
Adding Series
To add an additional series to the plot define a new set of series-specfic parameters following the series# naming scheme (#: any number). For every new series define the parameter names (series#_values, series#_strokeColor & series#_strokeWidth) and define their values in the script.
3. XY Chart
Expected Outputs
| xlabel | Label for the x axis |
| ylabel | Label for the y axis |
| title | Plot title |
| ymin | Y-axis minimum |
| ymax | Y-axis maximum |
| xmin | X-axis minimum |
| xmax | X-axis maximum |
| series1_xvalues | X values of the plotted series |
| series1_yvalues | Y values of the plotted series |
| series1_error | Errors on the data points in the plotted series. If not declared, by default the error is set to 0 |
| series1_fillColor | Color of the data points in series 1 |
| series1_strokeColor | Color of the stroke for series 1 |
| series1_strokeWidth | Strokewidth for series 1 |
Adding Series
To add an additional series to the plot define a new set of series-specfic parameters following the series# naming scheme (#: any number). For every new series define the parameter names (series#_xvalues, series#_yvalues, series#_error, series#_fillColor, series#_strokeColor & series#_strokeWidth) and define their values in the script.

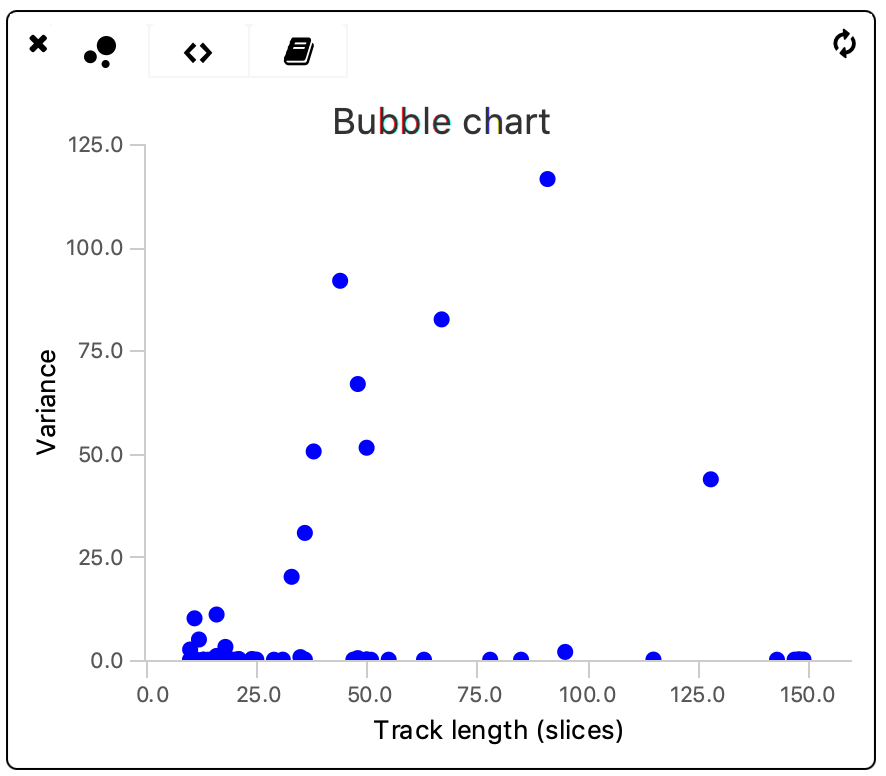
4. Bubble Chart
Expected Outputs
| xlabel | Label for the x axis |
| ylabel | Label for the y axis |
| title | Plot title |
| ymin | Y-axis minimum |
| ymax | Y-axis maximum |
| xmin | X-axis minimum |
| xmax | X-axis maximum |
| series1_xvalues | X values of the plotted series |
| series1_yvalues | Y values of the plotted series |
| series1_size | Size of the bubble |
| series1_label | Label of the bubble when the mouse is moved to a specific data point |
| series1_color | Color of the bubble |
| series1_markerColor | Color of the label when the mouse is moved to a specific data point |
Note that the series#_size, series#_color, and series#_label have to be provided as a list with the same length as the number of data points. In this way it is possible to set a different size, color and label for each of the plotted bubbles. In case the same size and color should be used for all bubbles define these parameters within the iterating loop as shown in example 4 of the How to use Scriptable Widgets tutorial.
Adding Series
To add an additional series to the plot define a new set of series-specfic parameters following the series# naming scheme (#: any number). For every new series define the parameter names (series#_xvalues, series#_yvalues, series#_size, series#_label, series#_color & series#_markerColor) and define their values in the script.
5. Beaker
To implement a fully independently written widget use the ‘beaker’ scriptable widget. This undefined widget space gives the user unlimited possibilities to design widgets of choice.