Mars Rover BigDataViewer
Mars Rover has the option to show an identified and/or tracked molecule in the original video through the in-built BigDataViewer functionality. This is a very useful function for the visual inspection of molecules after analysis and gives the user the opportunity to validate their analysis visually.
The in-build video viewer is based on the BigDataViewer1 Fiji plugin. It can work with videos in either the XML/HDF5 or the N5 2 data formats. This tutorial can be referenced to find information on how to convert your video to a video in either the N5 or XML/HDF5 formats. We recommend using the N5 format for larger videos as this format allows for multi-threaded reading and writing and volatile viewing options. This significantly decreases the loading time and computing load in general.
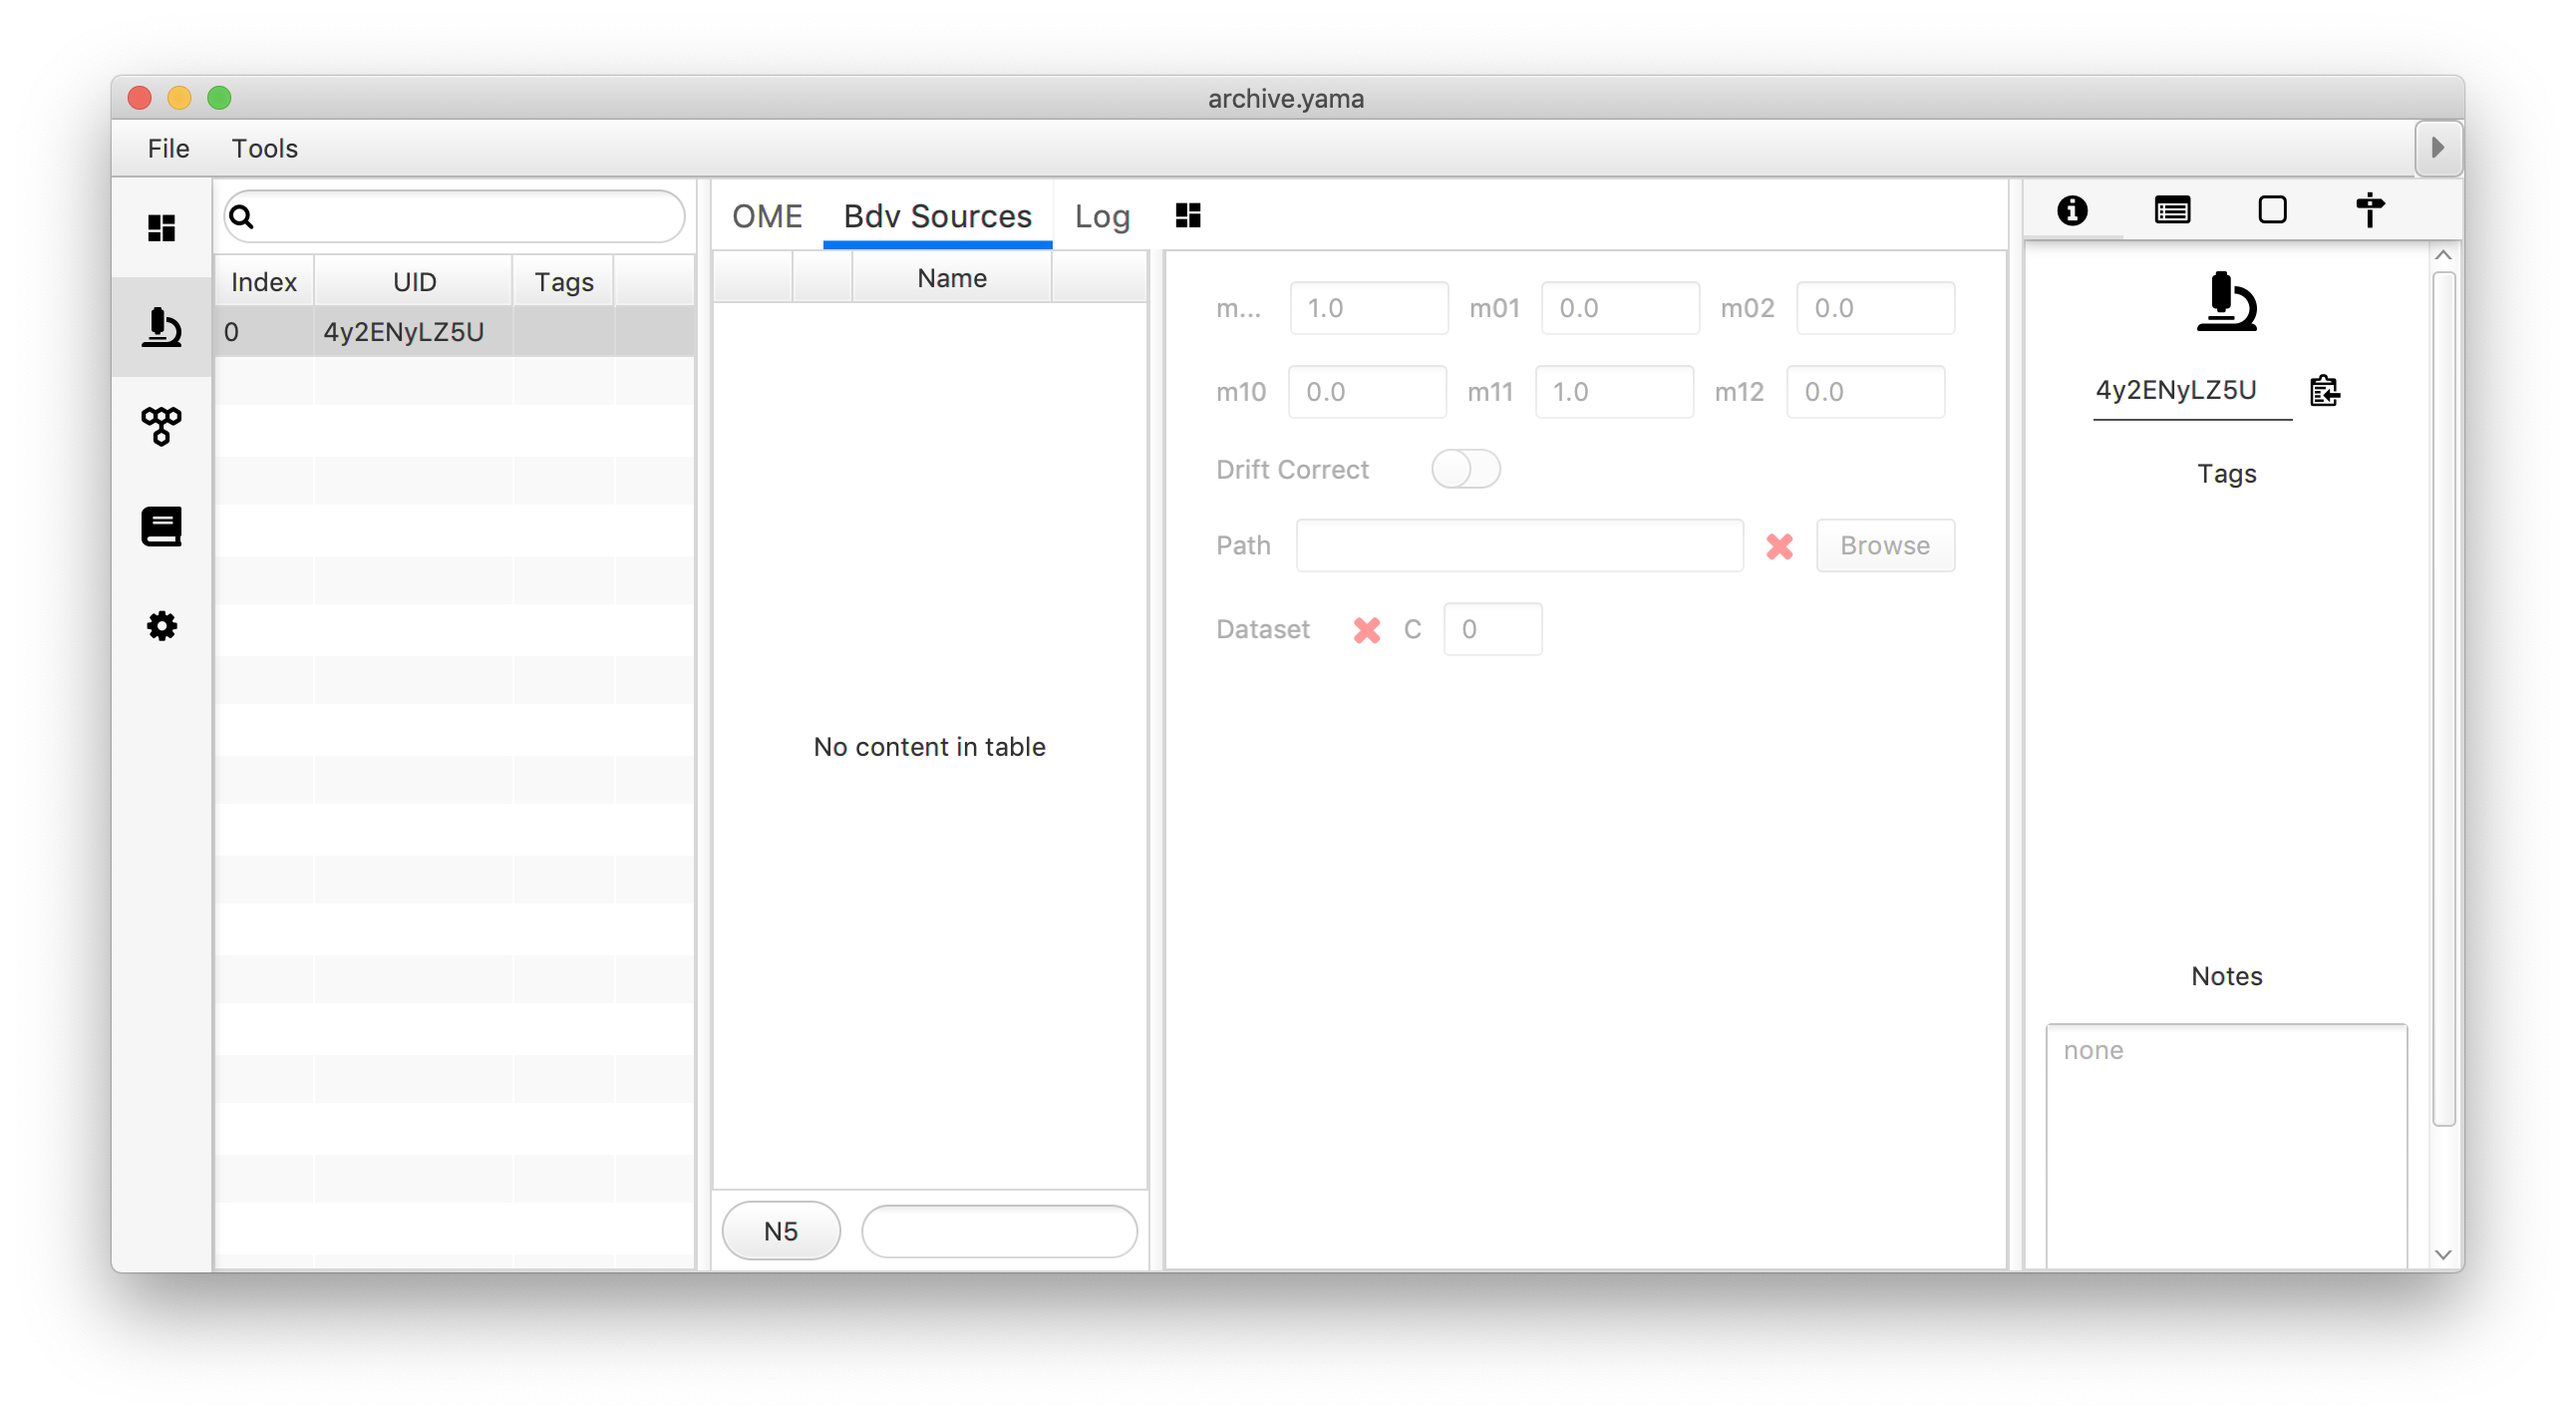
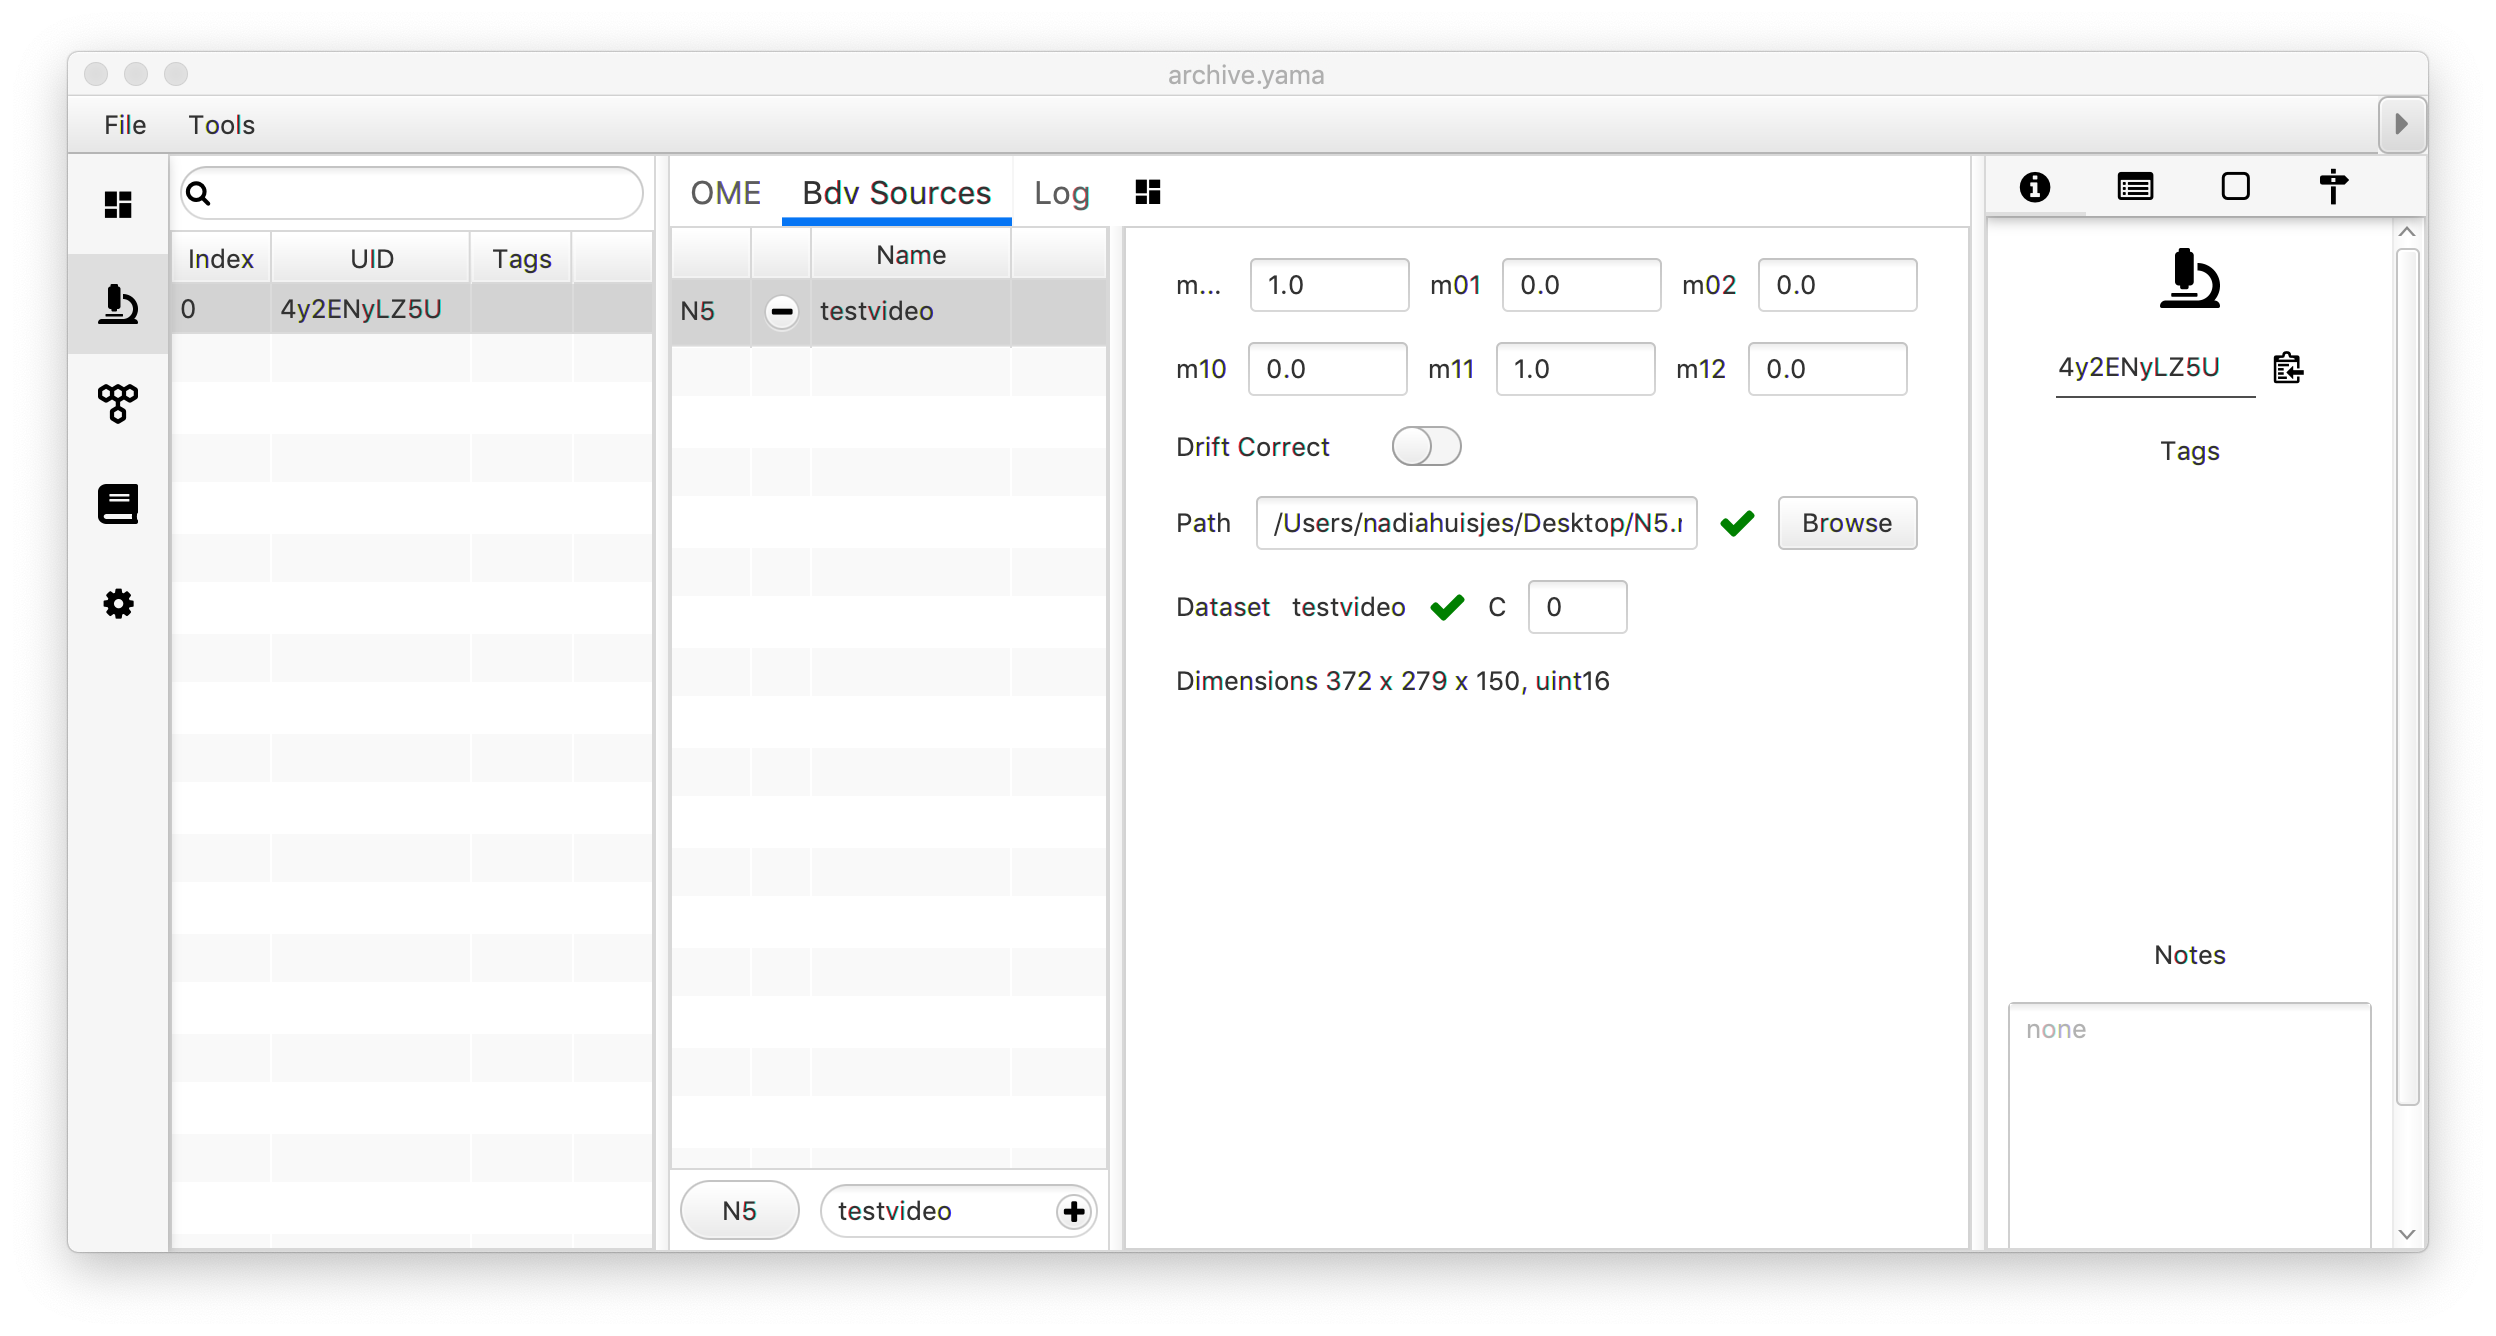
To couple the video file to the archive the ‘Bdv Sources’ tab in the Metadata area of the Archive is used. A new video coupling can be created using the menu on the left by entering the desired video name, selecting the file format, and pressing the ‘+’ button. This opens a file browser where the video of choice can be selected. Once the file path is established the menu on the right gives the user the opportunity to enter Affine 2D transformation matrix (see this tutorial on how to calculate this matrix), allow for drift correction and to select the channel (‘C’) of choice in the case of a multi-channel video.
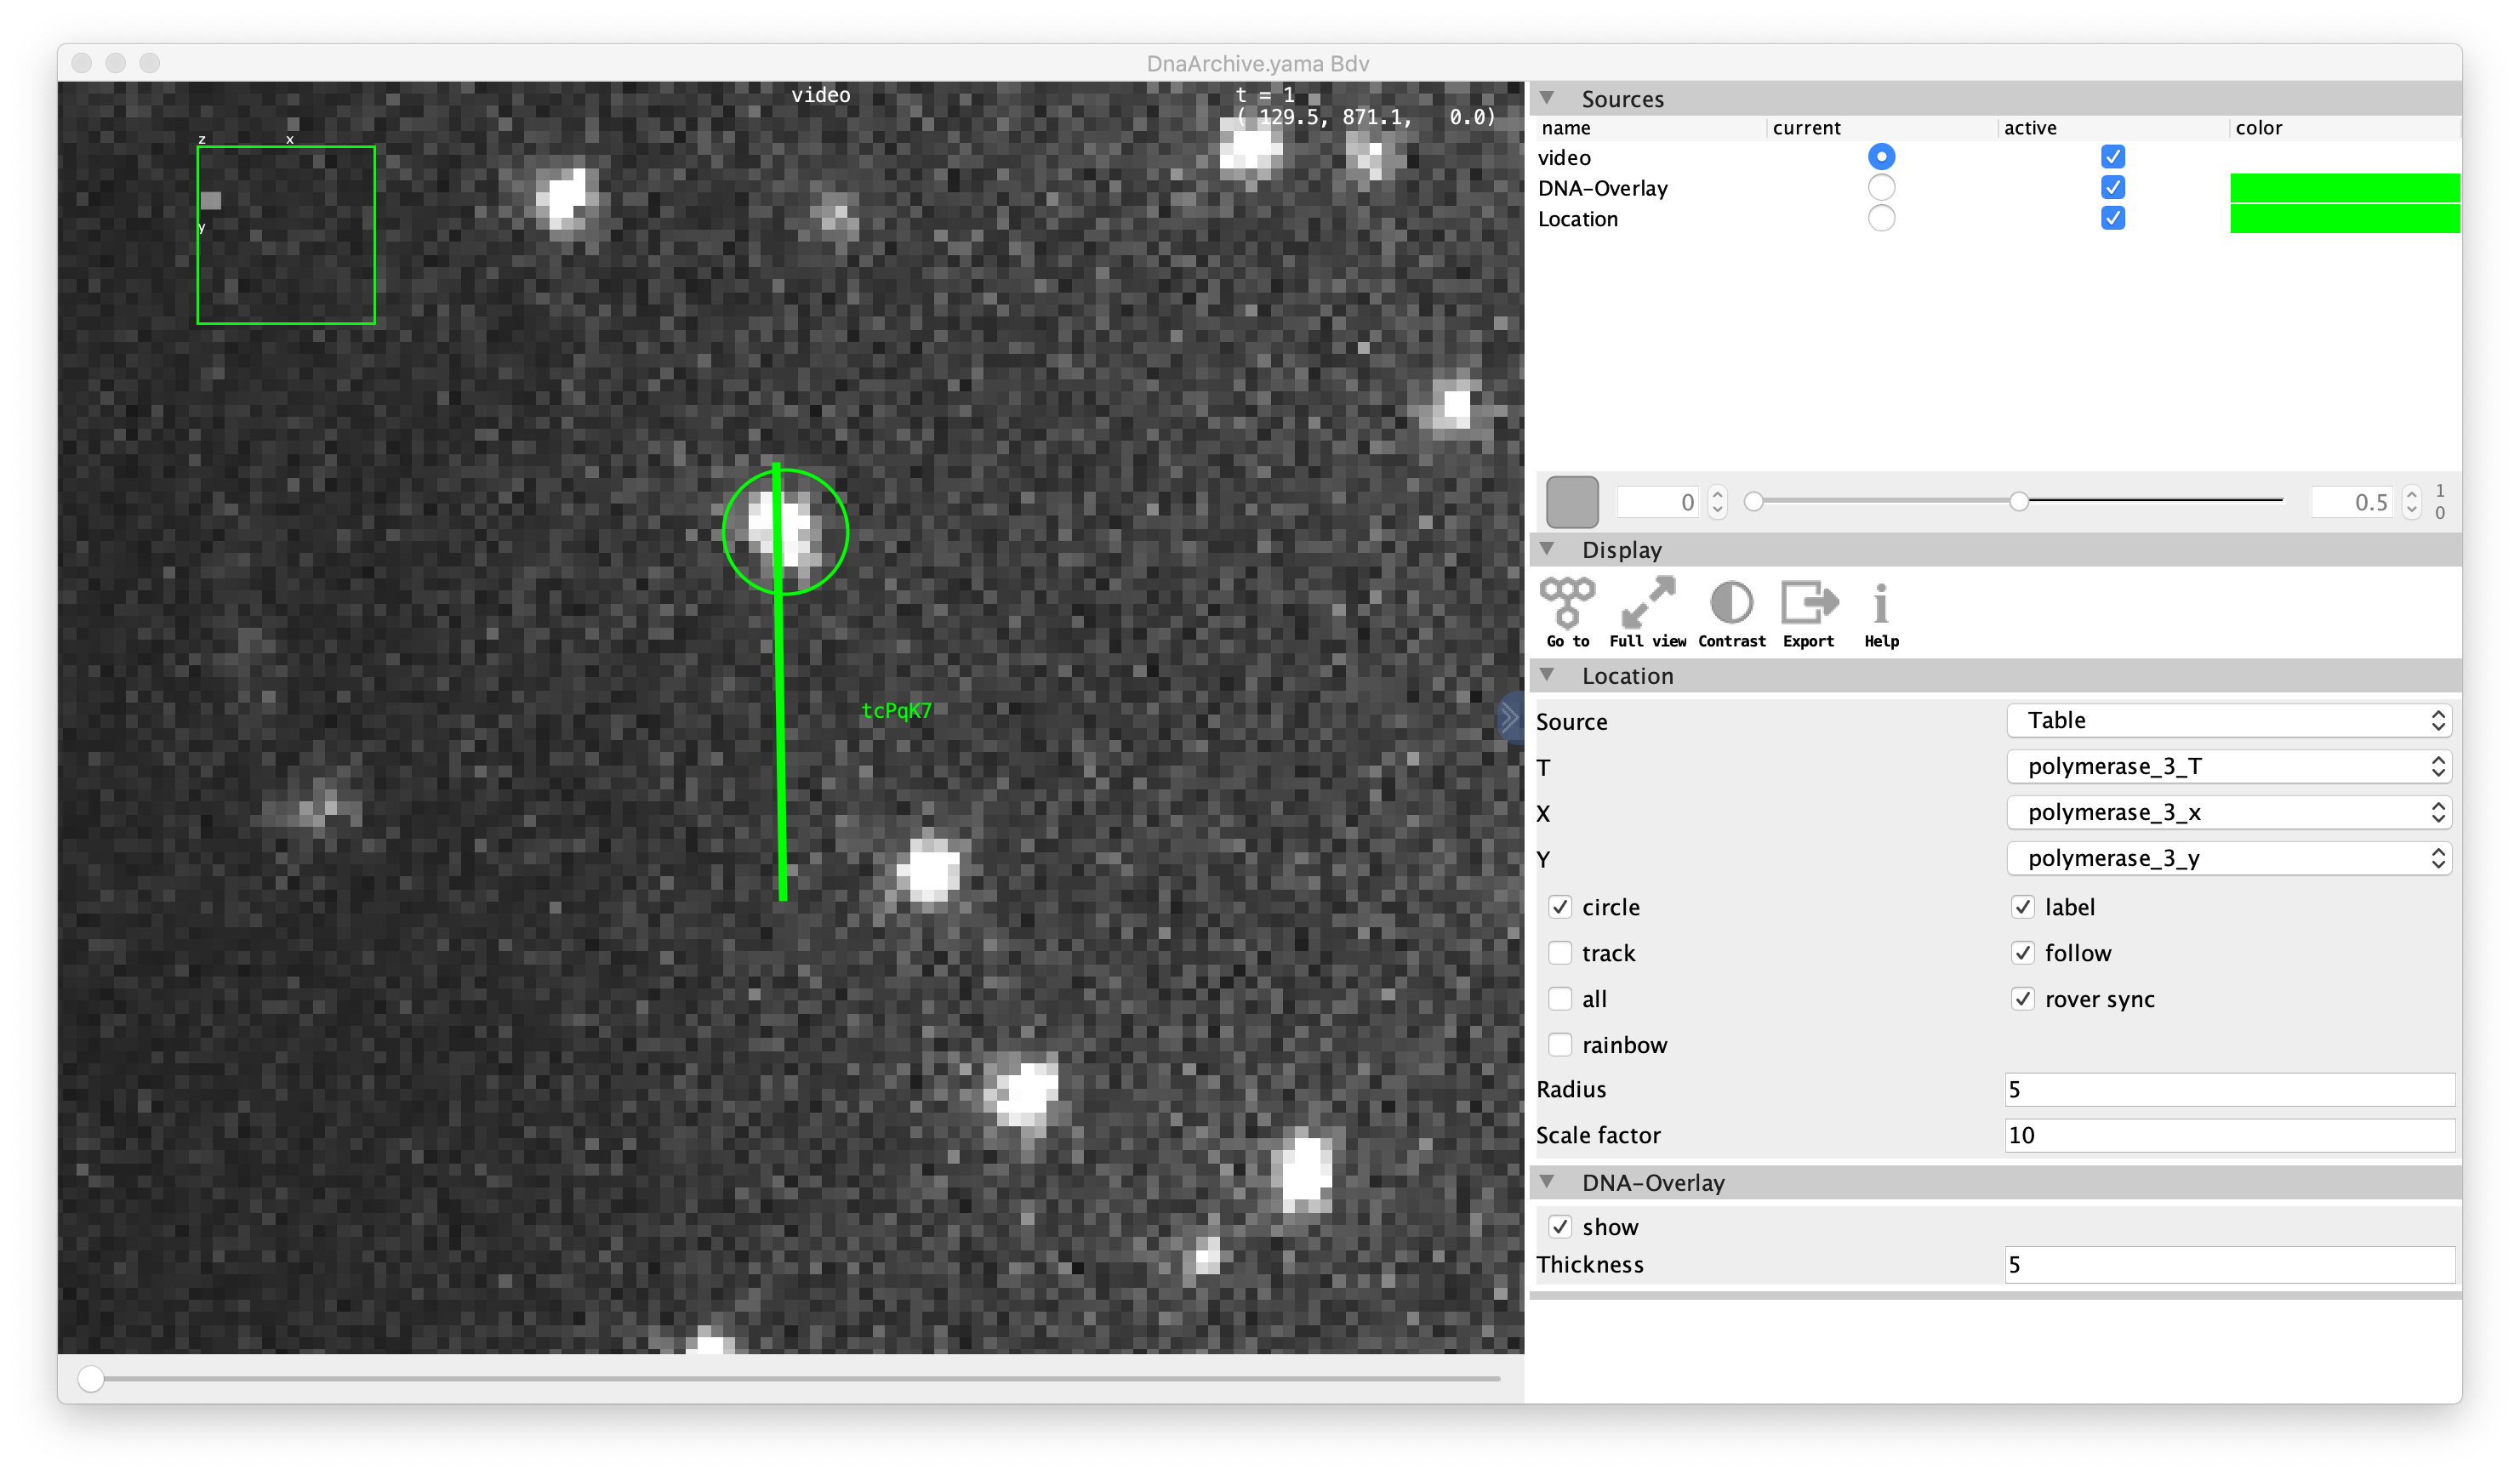
Once the video is coupled to the archive, the user can select a molecule of choice in the Molecules section of the Archive. The BDV video viewer is located in the ‘Tools’ menu under the ‘Show Video’ command. Now the video is opened at the position indicated by the molecule selected in the archive allowing the user to do visual inspection. Move the slider below the video to move through different frames (T).
Additional setting options can be found in the menu on the left of the viewer.
- Sources: lists the videos that are coupled to the Archive. These can be activated or deactivated from the viewer and the label color can be adjusted. This allows for the visualisation of the same location through different videos or channels, which is relevant for f.e. multi-colored microscopy experiments. The slider can be used to change the transparency of the label color.
- Display: general video options.
- Go to molecule: centers the video on the selected molecule.
- Full view: switches back to viewing the entire video. Please note that this can generate a large computing load in the case of big video files and many annotations shown.
- Contrast: optimize constrast settings.
- Export: export a video cropped around the molecule of interest. Cropping region can be set in the pup-up dialog window. Labels as selected in the ‘Location’ settings will not be exported to this video.
- Help: general video control options explained.
- Location:
- Source: source table for the coordinates.
- T: column to use for the slider, usually T or another column describing time.
- X: column to use for the x-coordinates, usually x
- Y: column to use for the y-coordinates, usually y
- Options:
- circle: show a circle on the average position of the tracked object.
- track: show the tracked trace of the molecule as recorded in the Archive. Can only be used in combination with an active ‘circle’ marker.
- all: shows all identified molecules. Can only be used in combination with an active ‘circle’ marker.
- rainbow: color molecule labels in rainbow colors. Especially useful when looking at all molecules at the same time.
- label: display a label listing the first characters of the UUID of the molecule. Can only be used in combination with an active ‘circle’ marker.
- follow: if checked, the circle marker will follow the tracked position with respect to T instead of displaying the average position. Can only be used in combination with an active ‘circle’ marker.
- rover sync: if checked, the viewer will update the displayed position when a different molecule is selected in the Archive.
- Radius: sets the radius for the ‘circle’ marker.
- Scale factor: factor that determines the zooming around the molecule of interest. Set to a lower value to display a larger portion of the video, and to a higher value to zoom more closely.
- DNA-Overlay: (DNA Archives only)
- show: show the identified DNA molecule as a colored line.
- Thickness: adjusts the thickness of the plotted line.
In all cases, press the ‘go to molecule’ button to refresh and incorporate the settings you just changed.
For more information on how to use the video viewer please visit the tutorial.
1 Pietzsch, T.; Saalfeld, S. & Preibisch, S. et al. (2015), “BigDataViewer: visualization and processing for large image data sets”, Nature Methods 12(6): 481-483, PMID 26020499
2 Heinrich, L.; Bennett D. & Ackermann D. et al. (2020), “Automatic whole cell organelle segmentation in volumetric electron microscopy”, BioRXiv, DOI: https://doi.org/10.1101/2020.11.14.382143