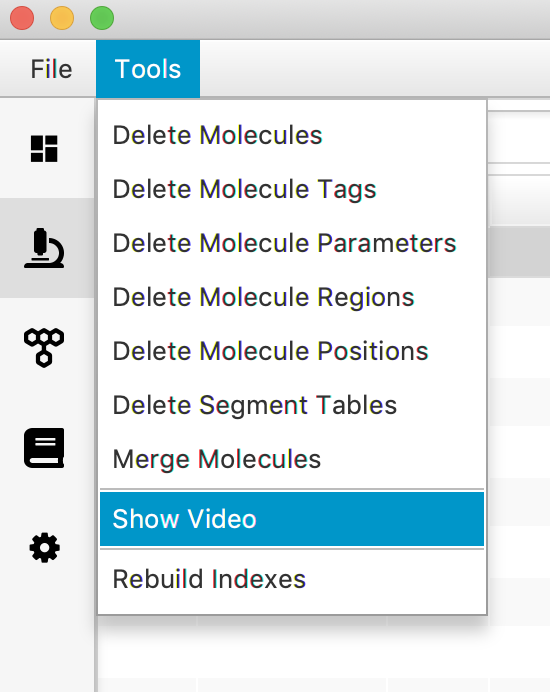
How to Find Tracked Molecules in the Video
level: advanced, duration: 15 min
This tutorial explores the Rover option to show a tracked molecule in the original video. This enables the user to visually validate the observed behavior and to export small videos showing the movement of a single molecule. The video viewer is based on the BigDataViewer1 plugin and as such requires converting the video of interest to the BigDataViewer file format XML/HDF5 or in the N5 format. We prefer to use the N5 over the XML/HDF5 because of the superior qualities. We will explain both options but we advise you to use N5.
The first part of this tutorial shows how to convert your video to either of these data formats, how to connect the video to the archive, and how to set up the parameters. These steps only have to be executed once per video per Archive and will then be saved for future use. The second part of the tutorial familiarizes the user with the viewer itself and with exporting options.
Part one: Video conversion and coupling to the archive
To start, download the ‘TestVideo.tif’ dataset from the git tutorials repository.
1. Converting the Video to N5 or XML/HDF5
N5
First open the video of interest in Fiji as a stack. Next select File>Save As>Export N5. This will open a dialogue window with the following settings:
- N5 root: used to set the root directory in which all N5 datasets of the project will be saved. Browse for a location in your file system, add the folder name and end with the .n5 format.
For Example: /Users/UserName/Data/N5_videos.n5 - Dataset: name of the data set you are converting.
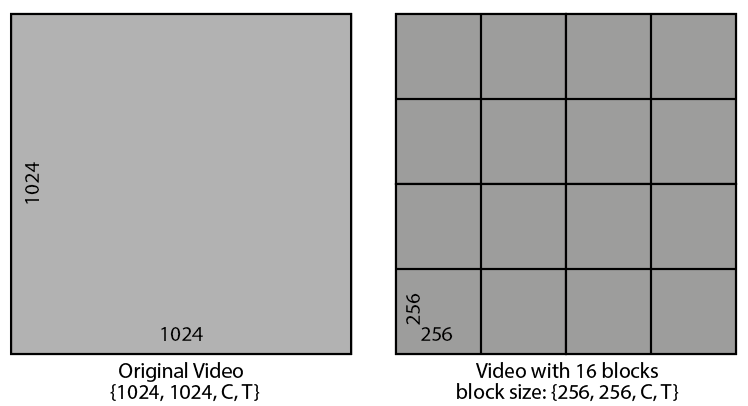
- Block size: determines in how many blocks the video will be converted. These blocks are either defined as XYT or XYZT. Usually blocks are defined such that the X and Y axis can be devided nicely in even blocks, and C & T are chosen as their full maximum. This would create XY-blocks as shown below that are grouped for all channels (C) and frames (T) per block.
For Example: {256, 256, 2, 150} for a video of 1024x1024 pixels to be split in 16 blocks with a total amount of 2 channels (C) and 150 frames (T).
- Compression: select a compression option. By default choose ‘gzip’.
- Metadata type: select ‘None’.
- Thread count: select how many CPUs will be dedicated to do the conversion.
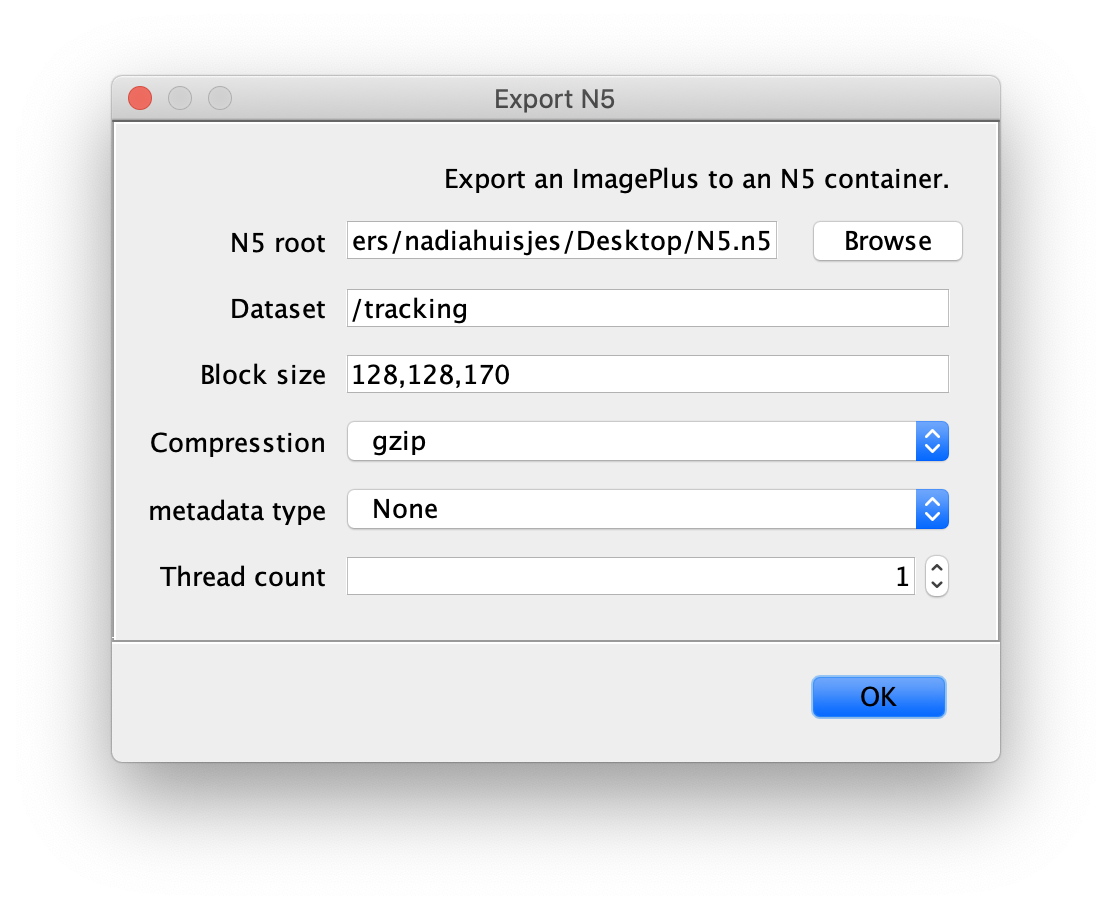
Press ‘ok’ and wait for the command to be finished. Find the exported dataset at the specified file path. More information on the N5 data format can be found here.
XML/HDF5
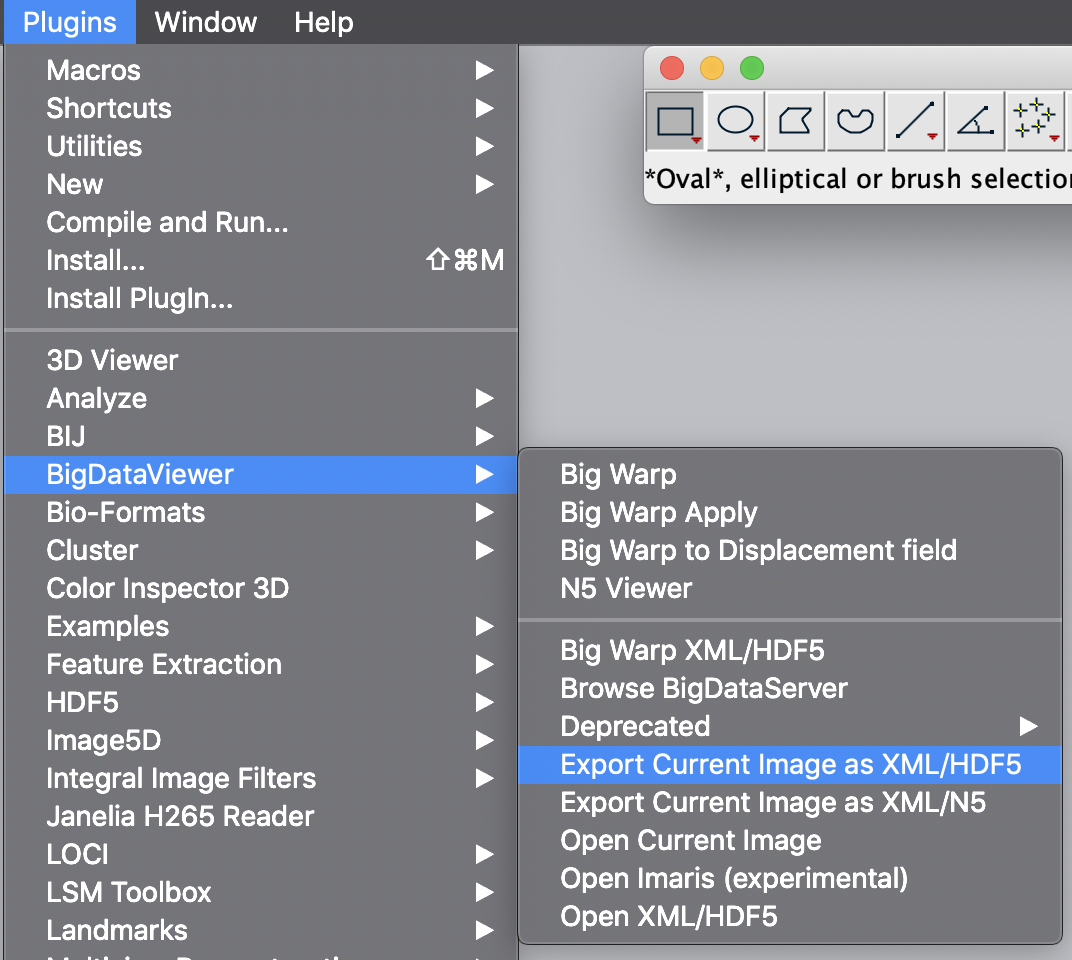
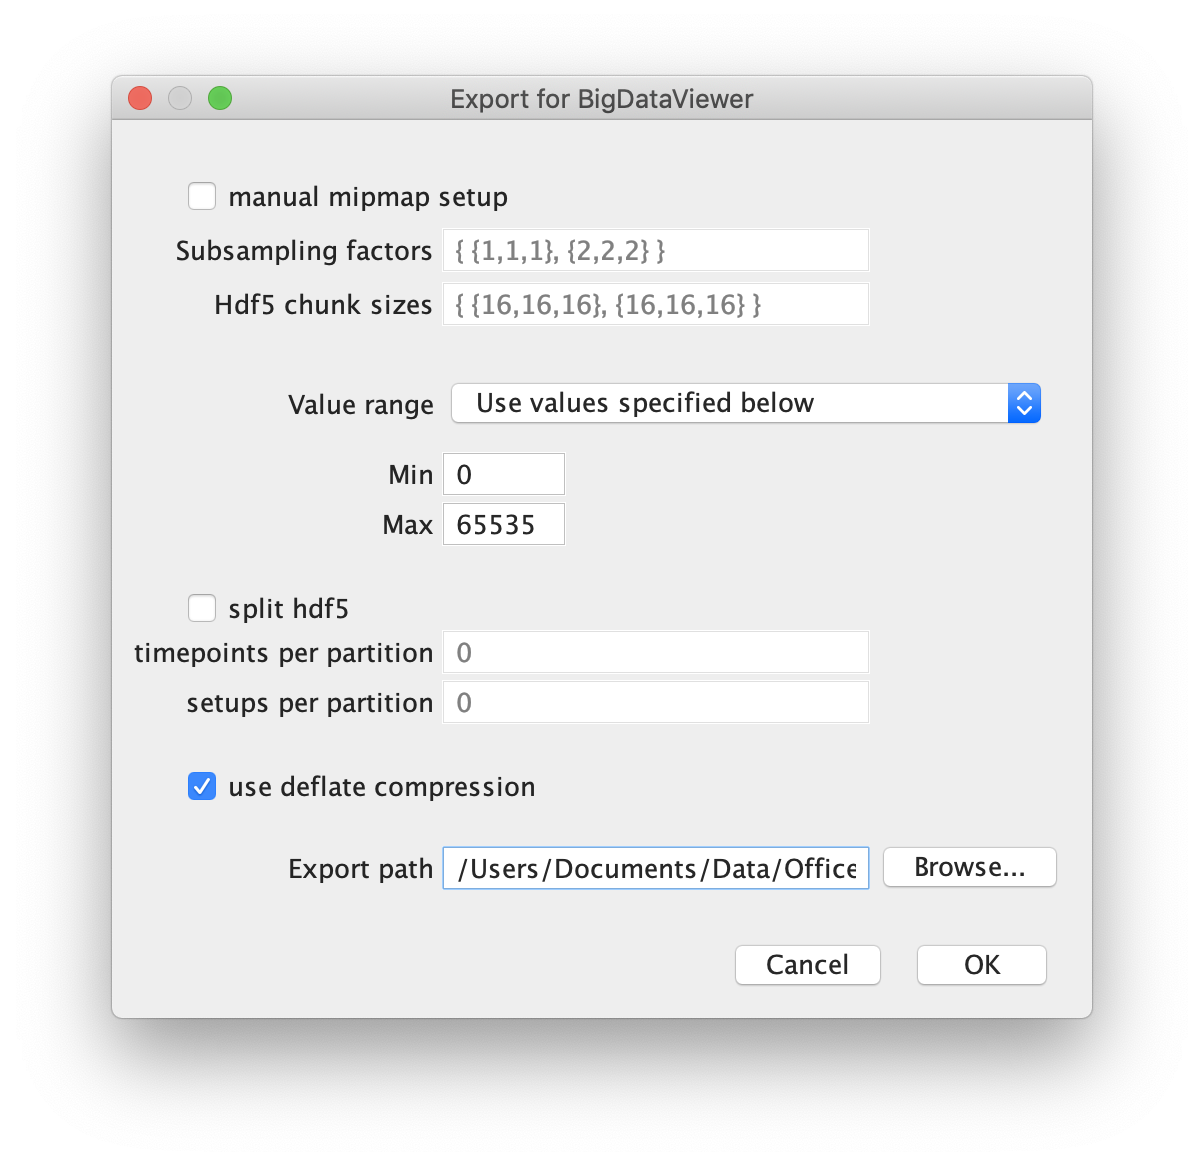
First open the video of interest in Fiji as a stack. Next select the BigDataViewer plugin and select the function “Export Current Image as XML/HDF5”. This will open a dialogue in which the export path has to be set. Press ok and wait until the export process has finished. Find the exported video at the specified file path.
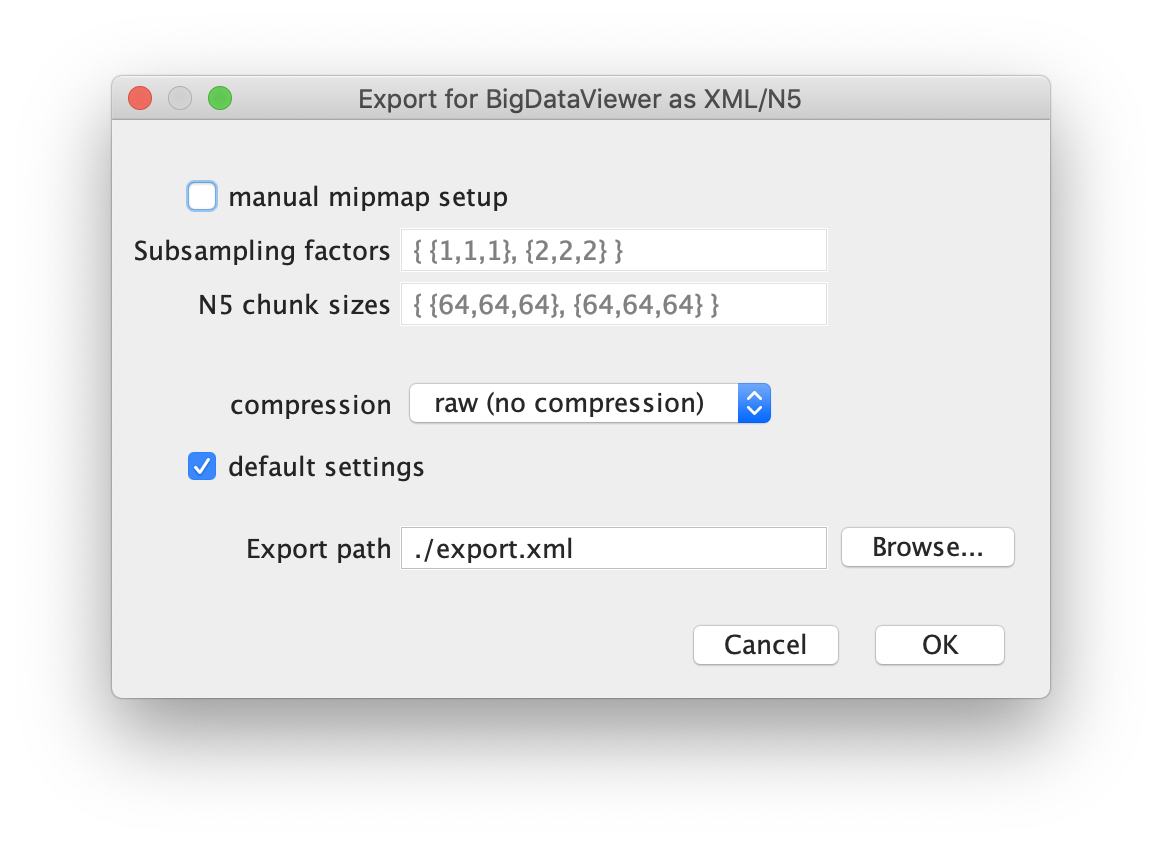
For further information and in-depth documentation about this software and file format please have a look in the BigDataViewer documentation. The XML and H5 files for TestVideo.tif can also be found in the tutorial repository.
2. Coupling the file to the Molecule Archive
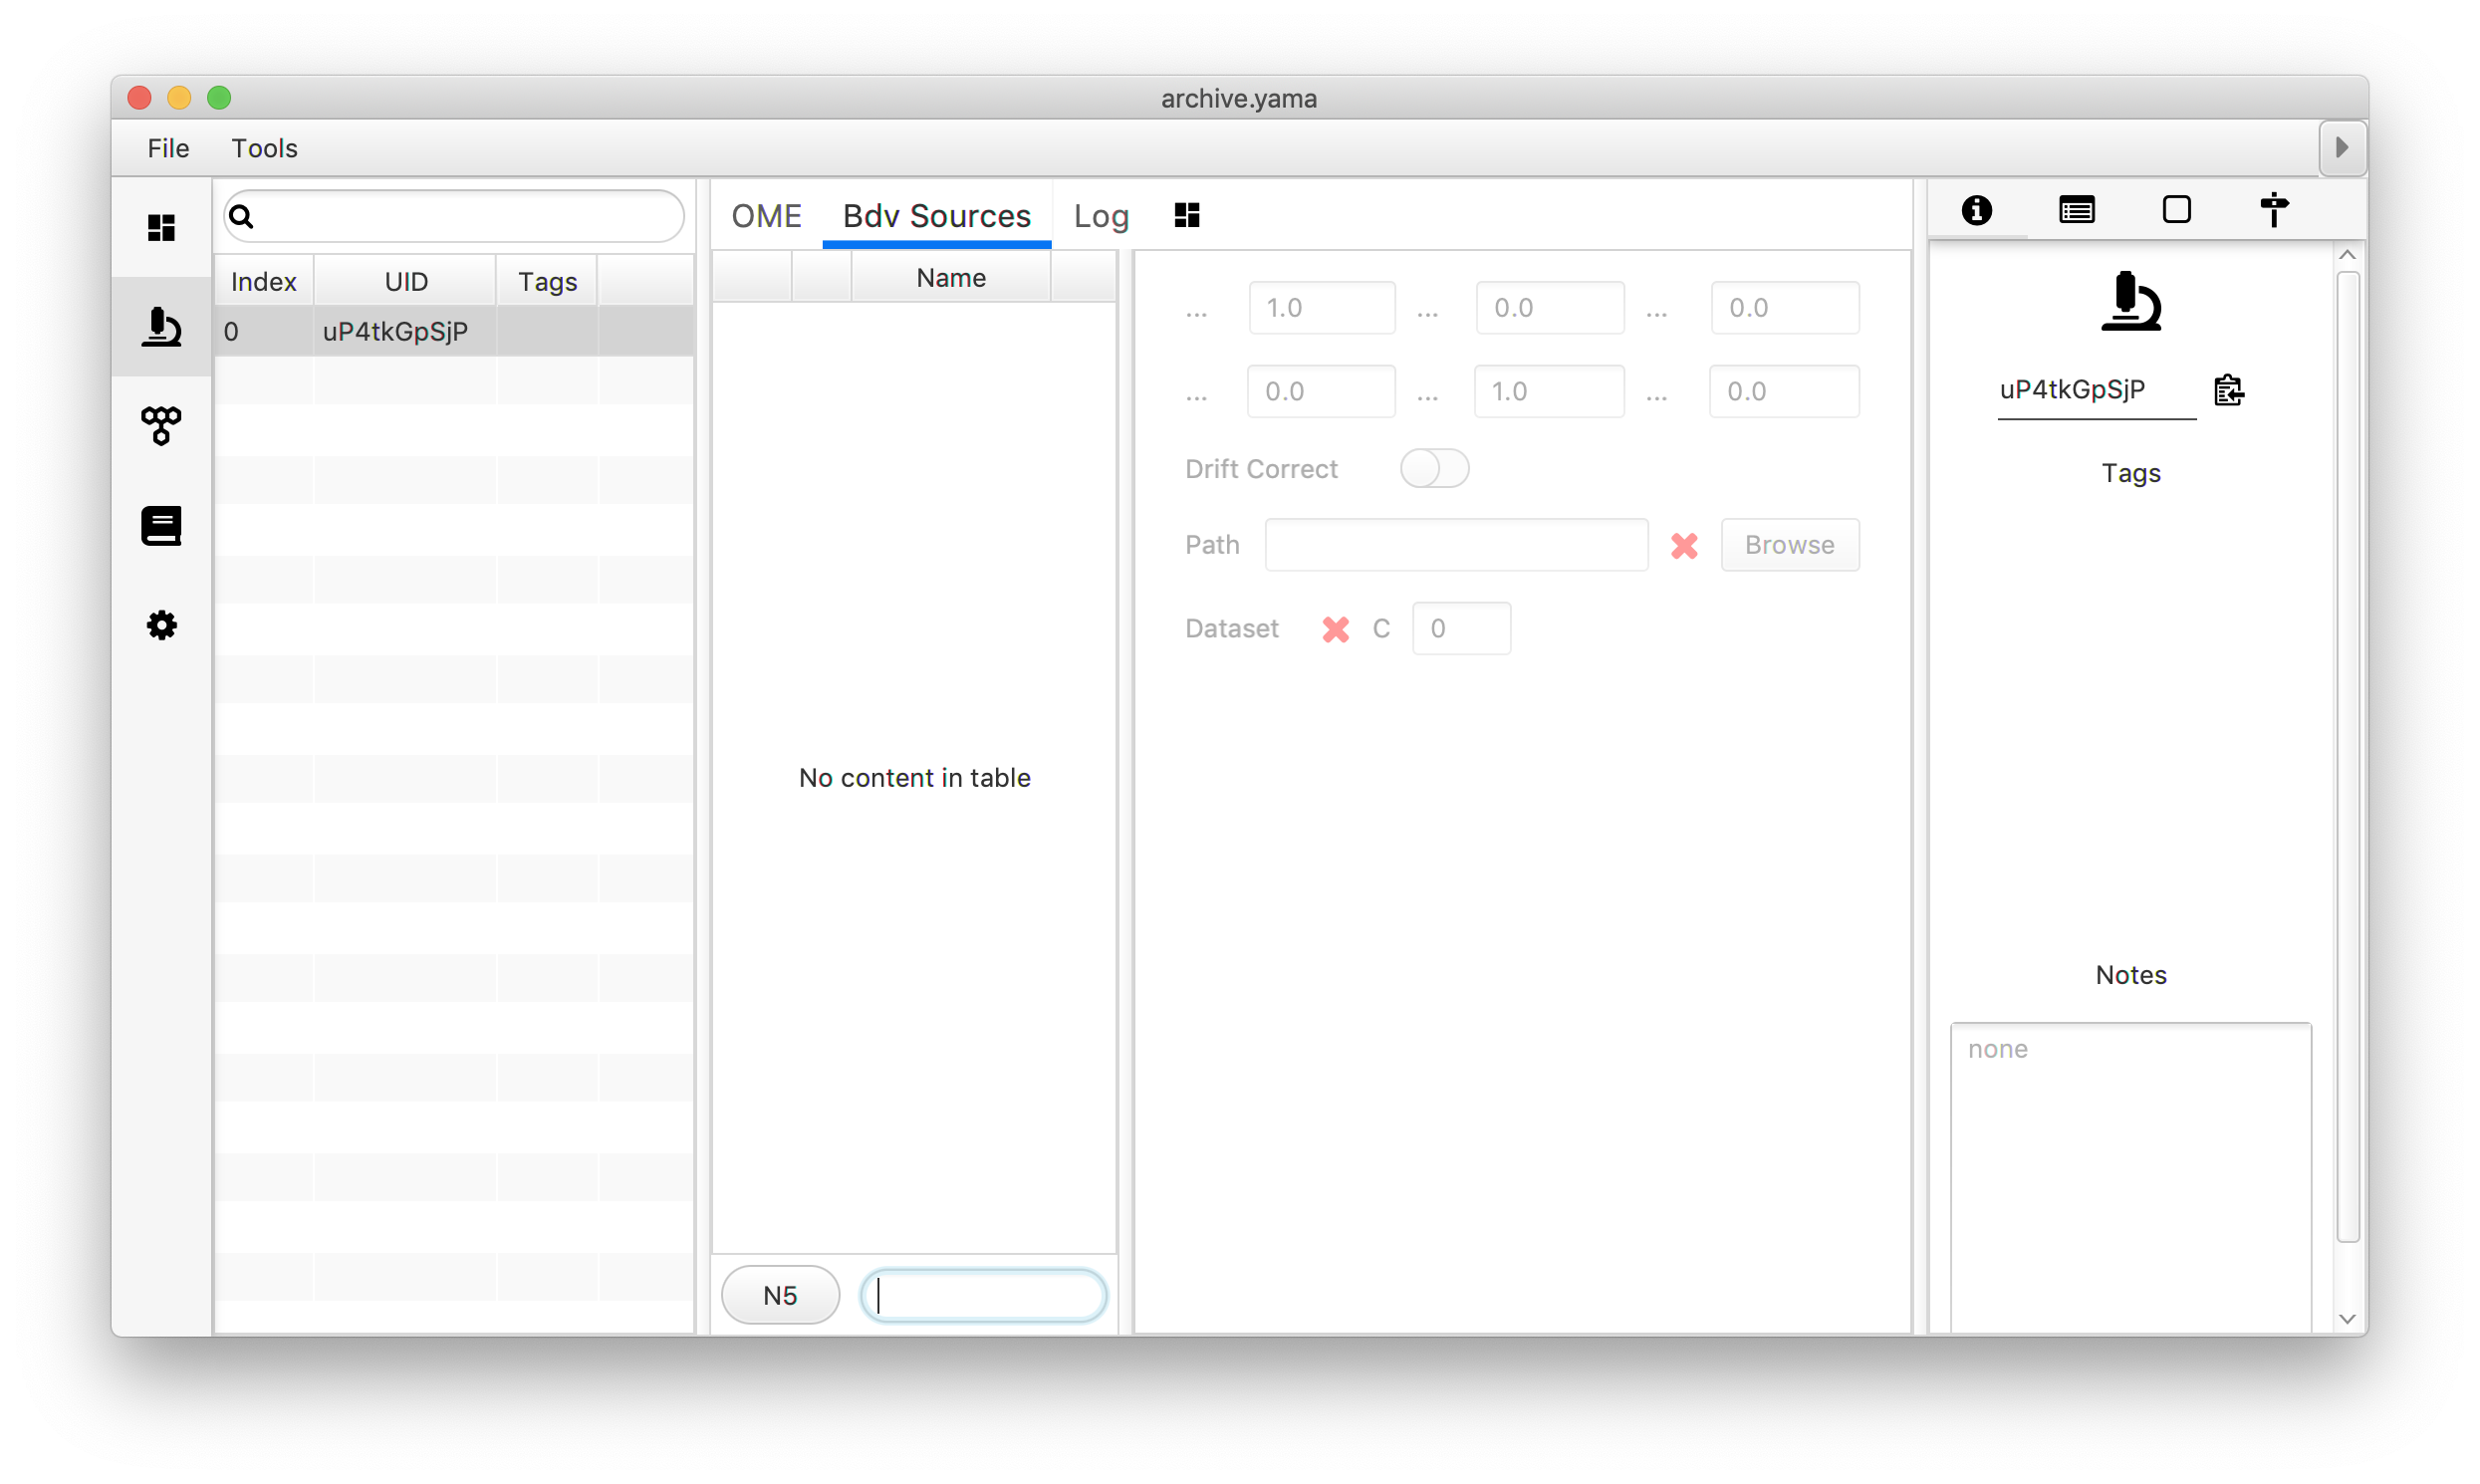
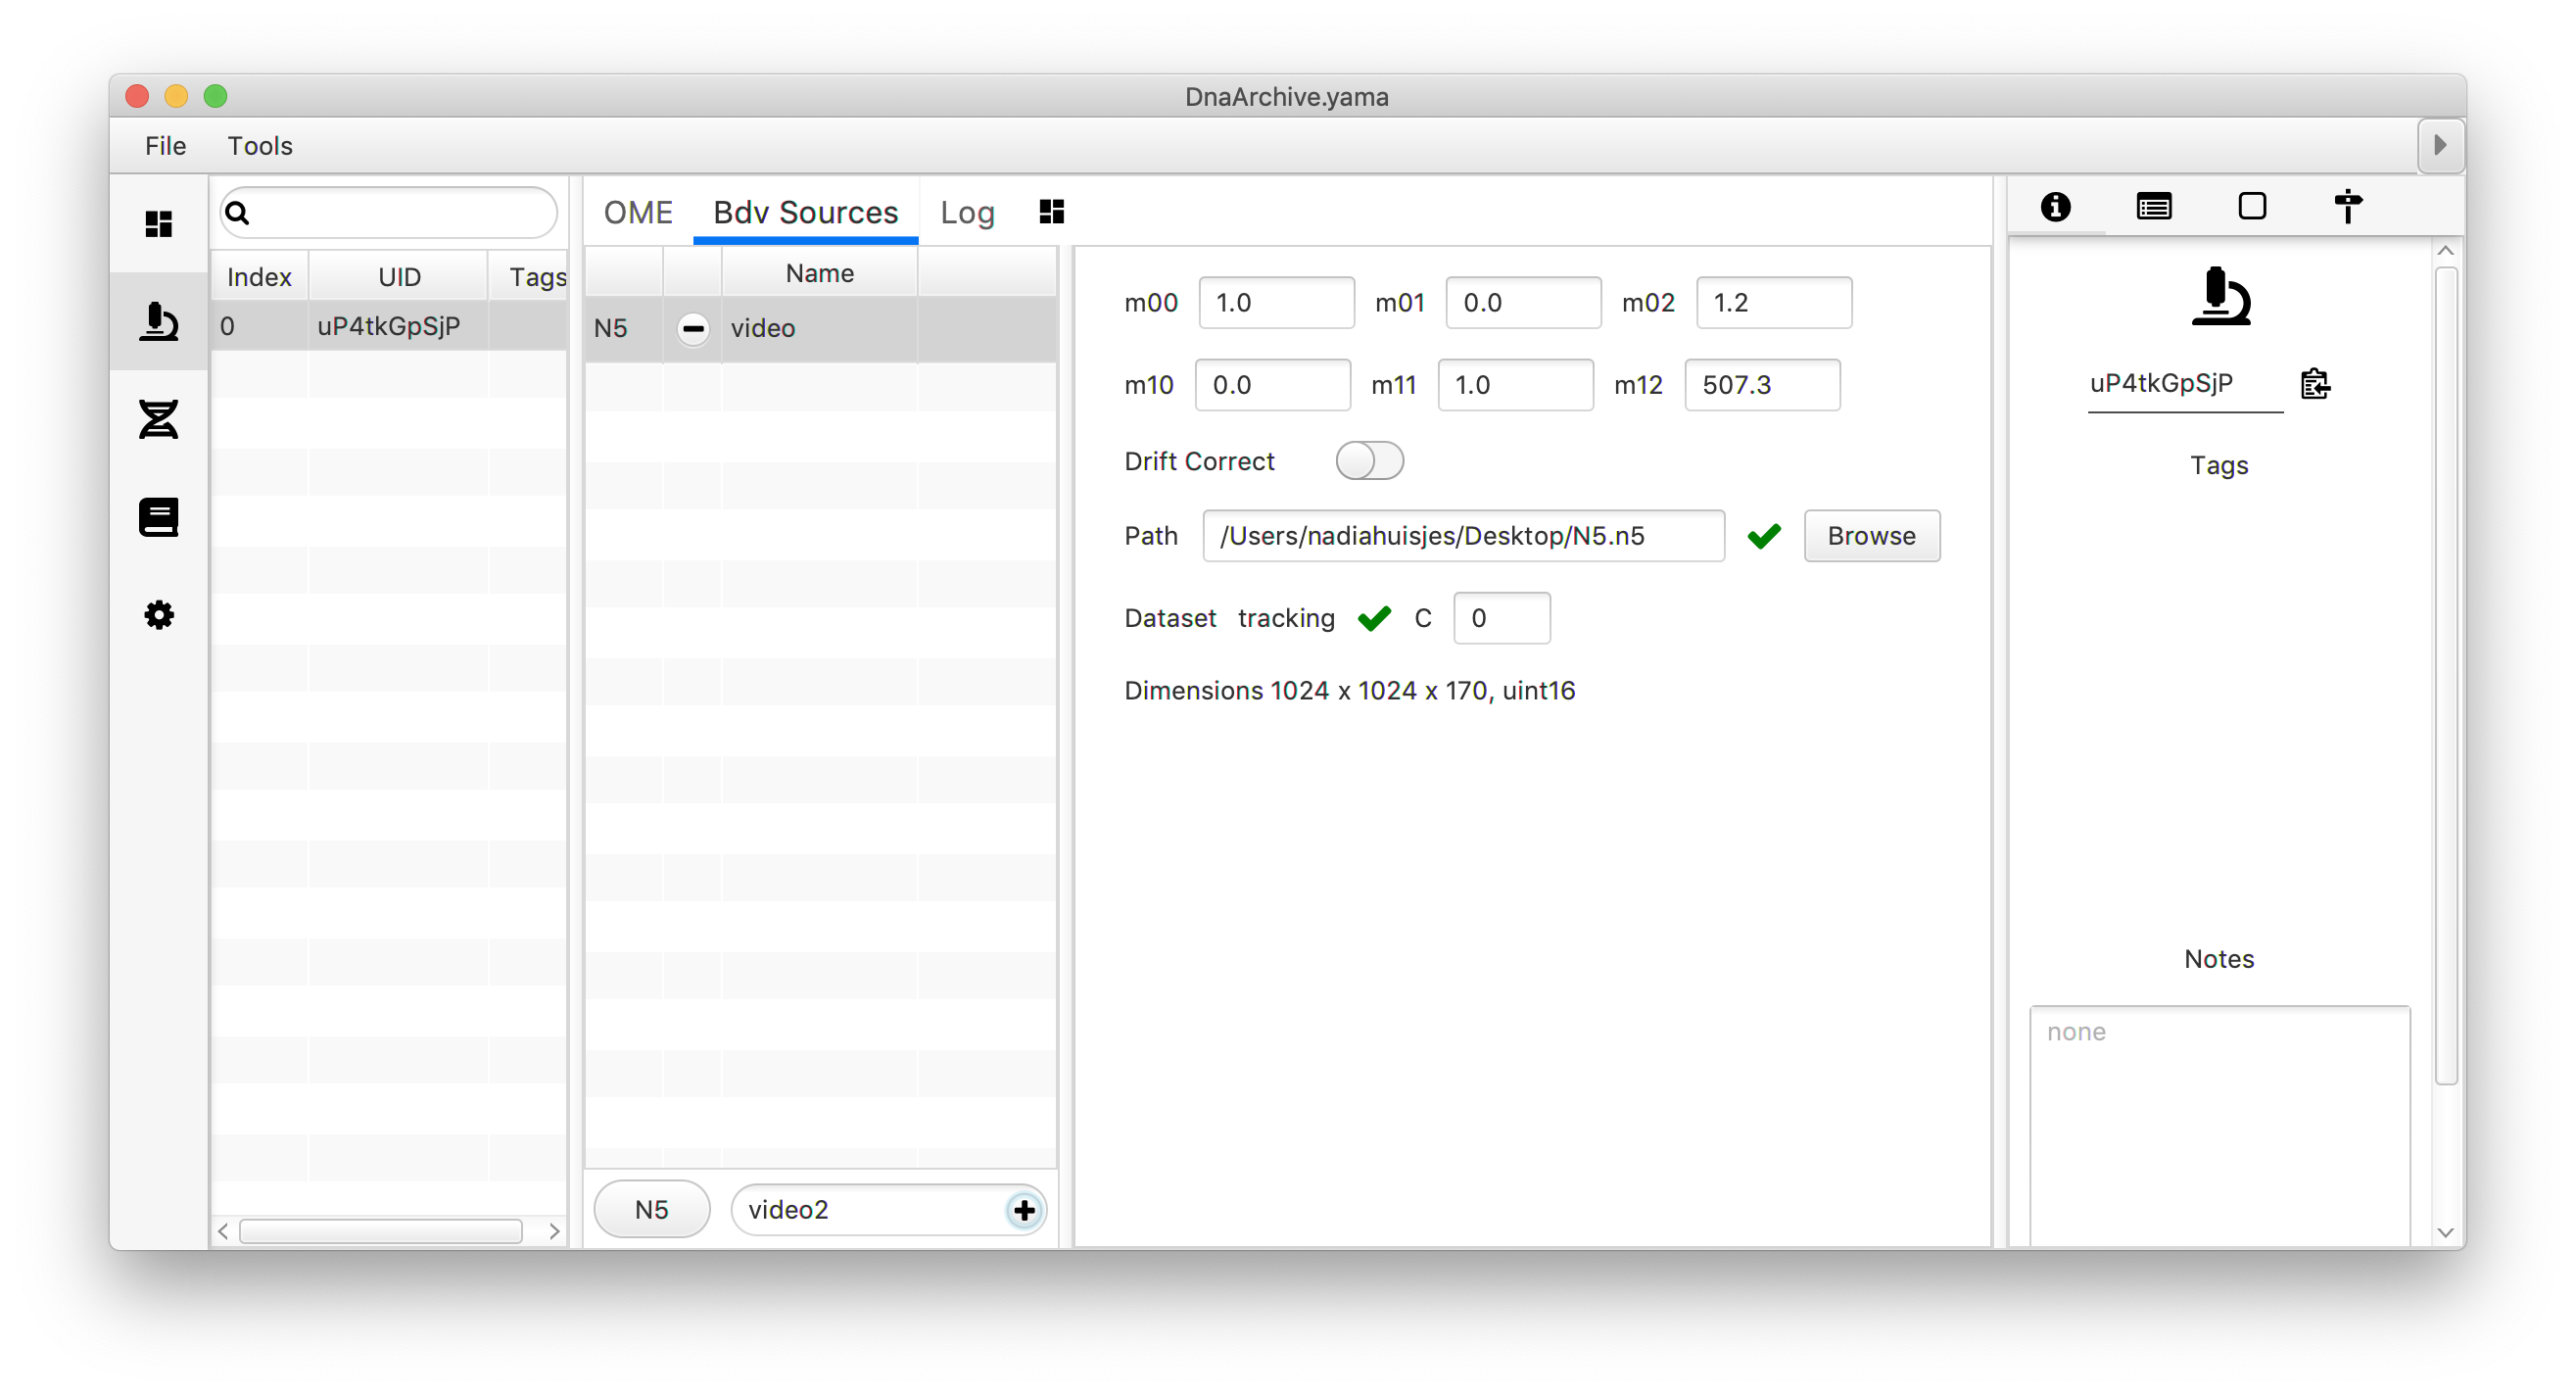
The next step is to couple the generated N5 or HDF5 file to the corresponding Archive. Open the Molecule Archive (Plugins>Molecule Archive Suite>Molecule>Open Archive) and go to the ‘Metadata’ tab. Move to the ‘Bdv Sources’ tab in the middle window and move to text input field. Select the file format by clicking the ‘N5/HD5’ button, provide a name and press the + button.
Select the file:
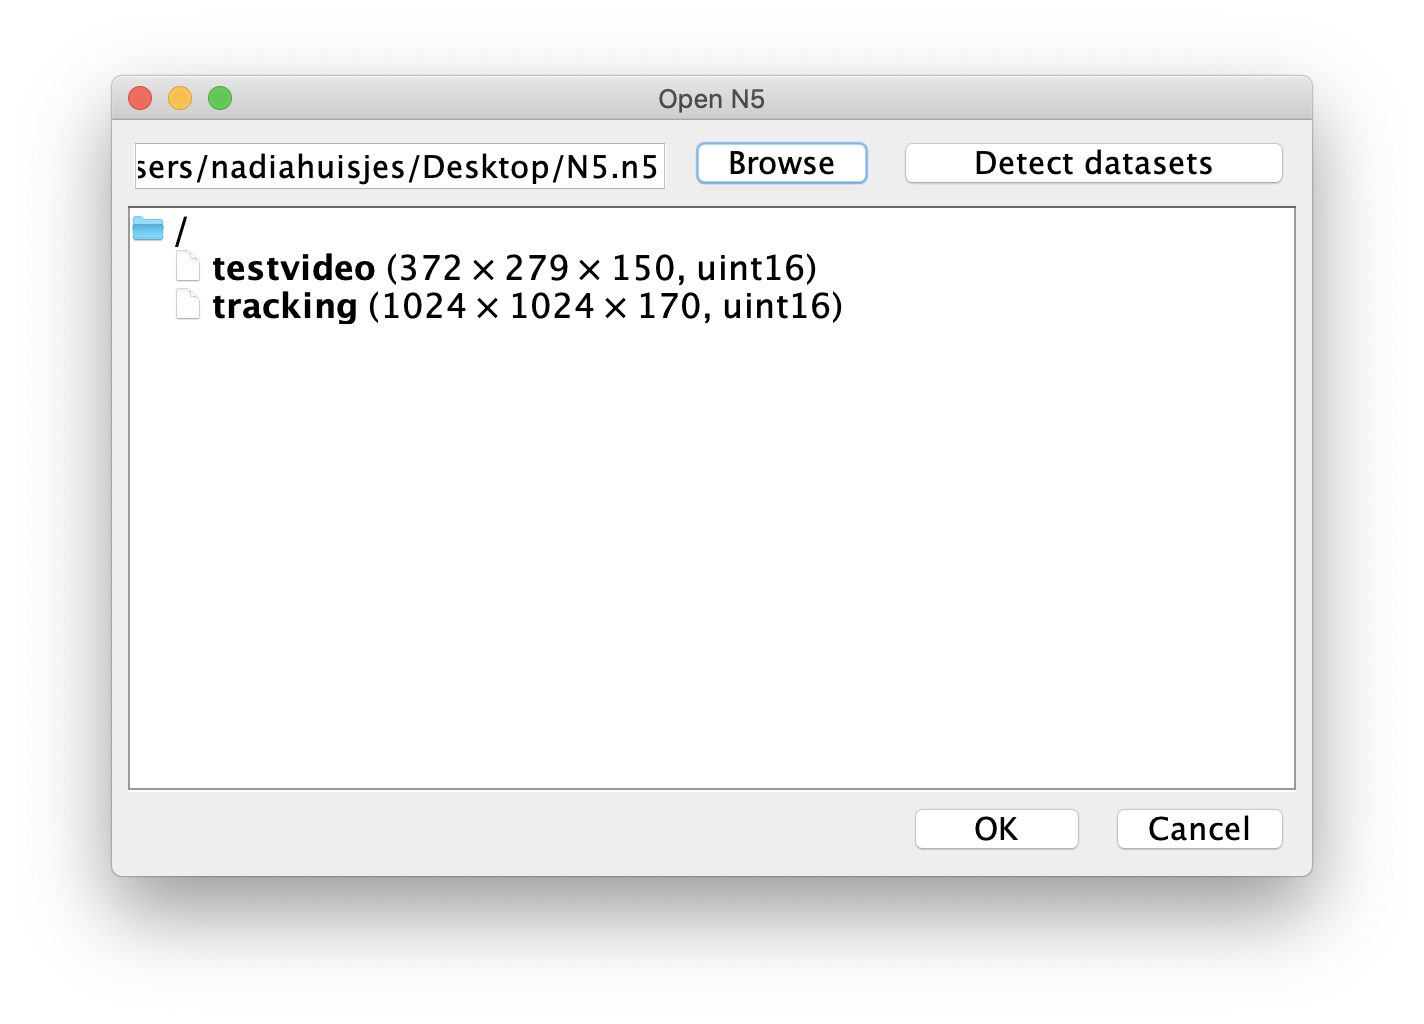
- N5: browse to the N5 root folder (name.n5) that you generated in step 1 of this tutorial. Select and press ‘Choose’. Now press ‘Detect datasets’ to detect the n5 datasets present in this root folder. Select the right one and press ok. The dataset selection window should look similar to the one below.
- XML/HDF5: select the ‘video.xml’ file in the browser (this file was generated in step 1 of this tutorial). Press ok.
If done correctly, the video name should appear in the Bdv Sources list, and when clicked the parameter window shows up. When the file coupling was successful green ticks are placed near to ‘path’ and/or ‘dataset’ (only in the case of N5). Note that during this coupling step the path to the file is specified. When changing the location of the video on the computer, a new coupling to the new location of the file has to be set up. The window also allows the user to set parameters for an Affine2D matrix if required and correct the video for drift.
Part two: How to work with the video viewer
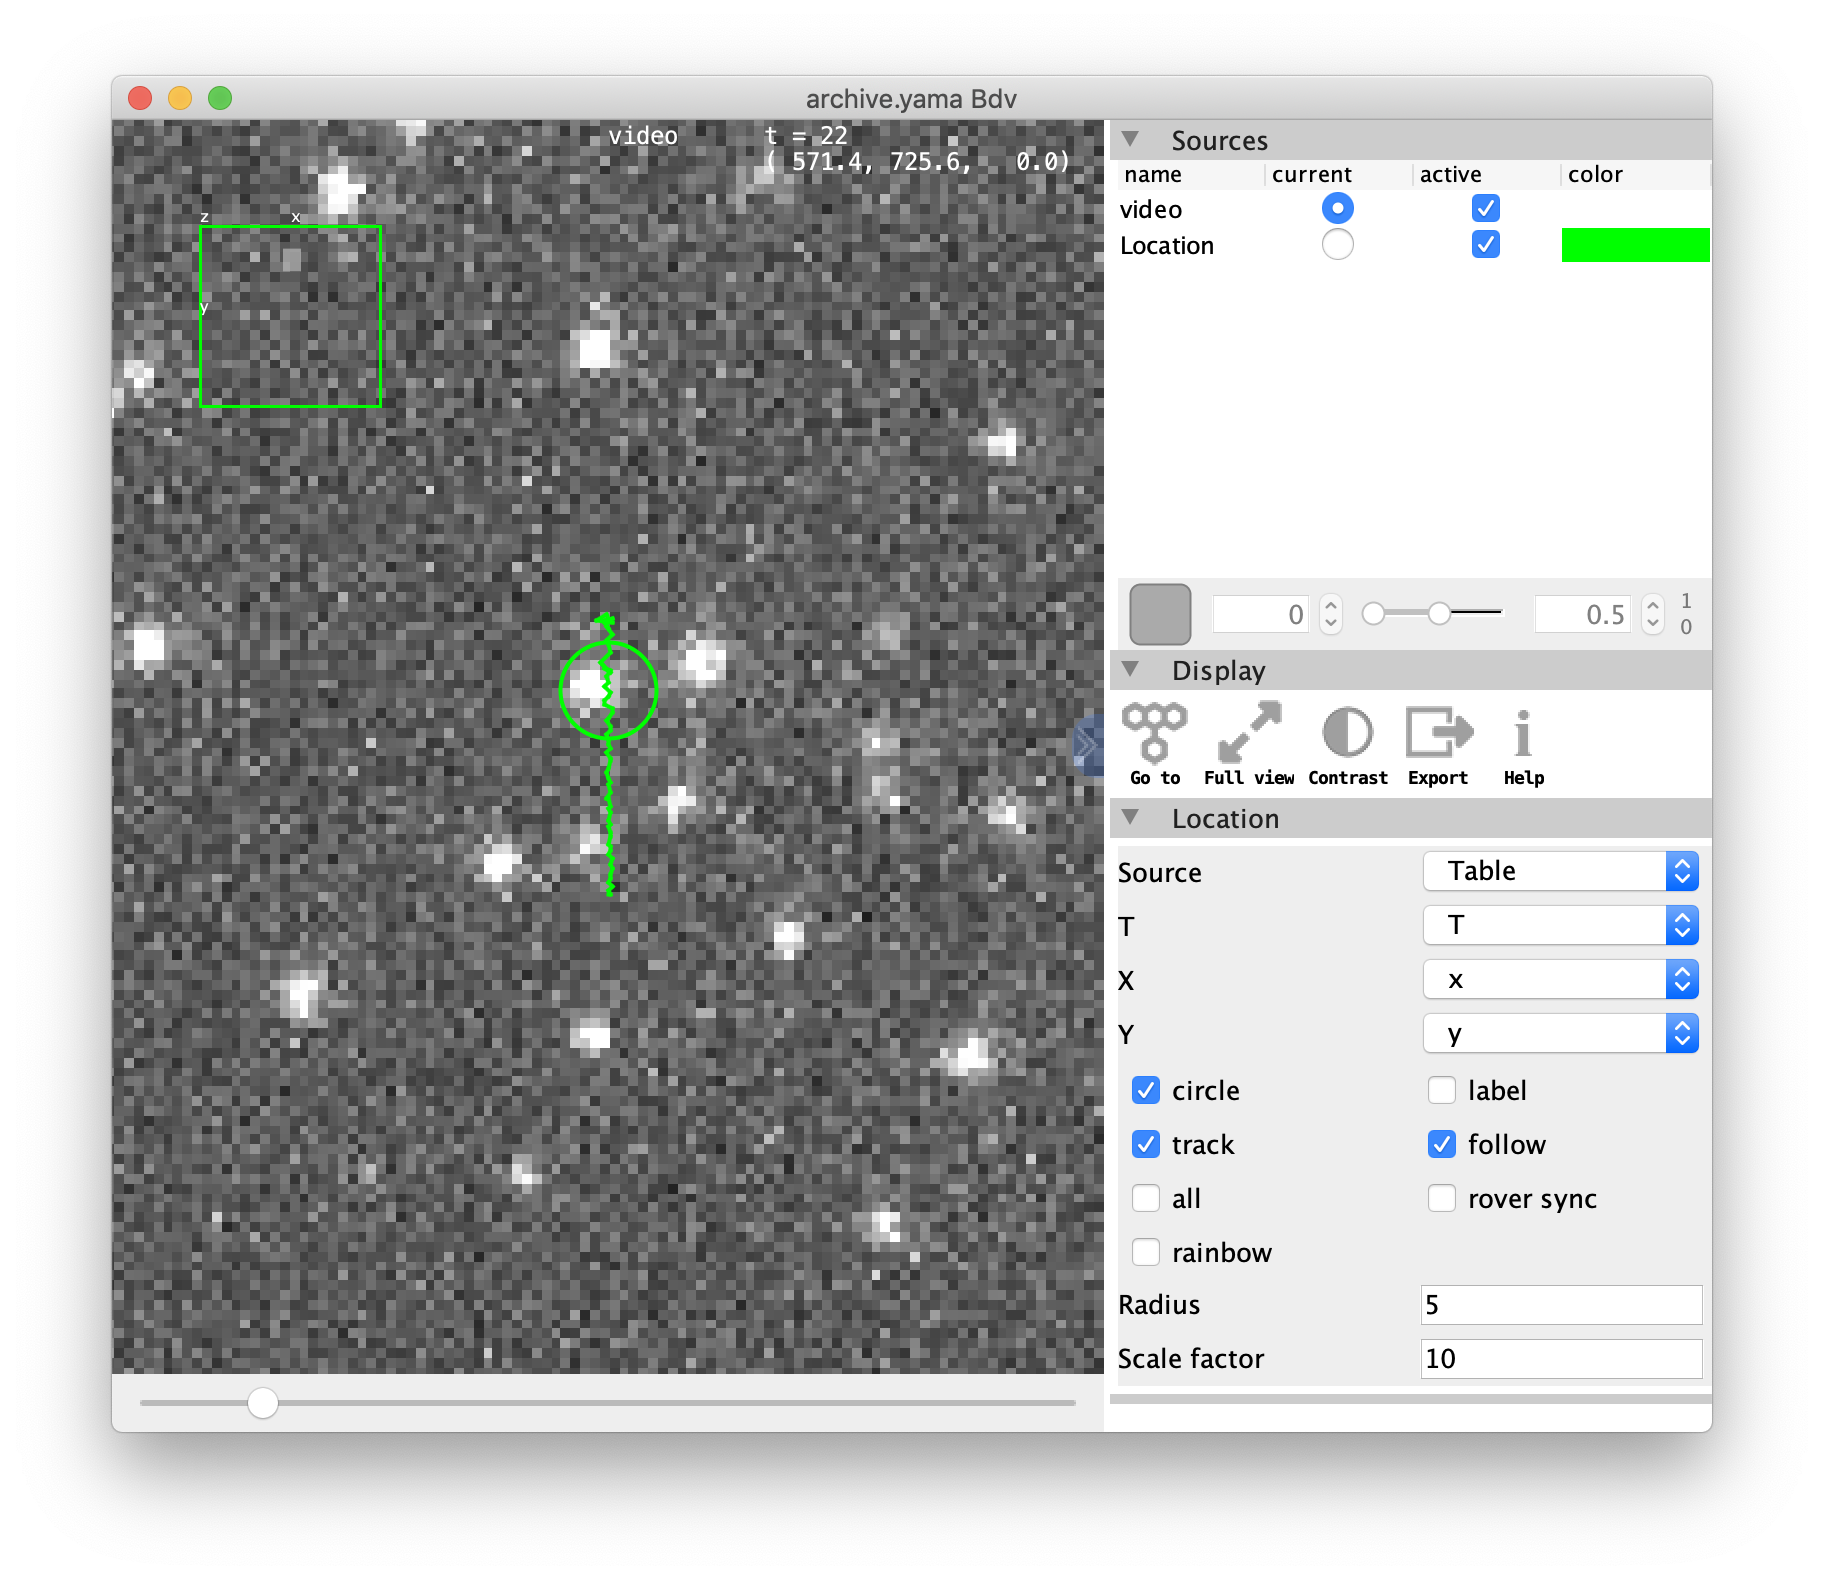
3. Show the Tracked Molecule in the Video
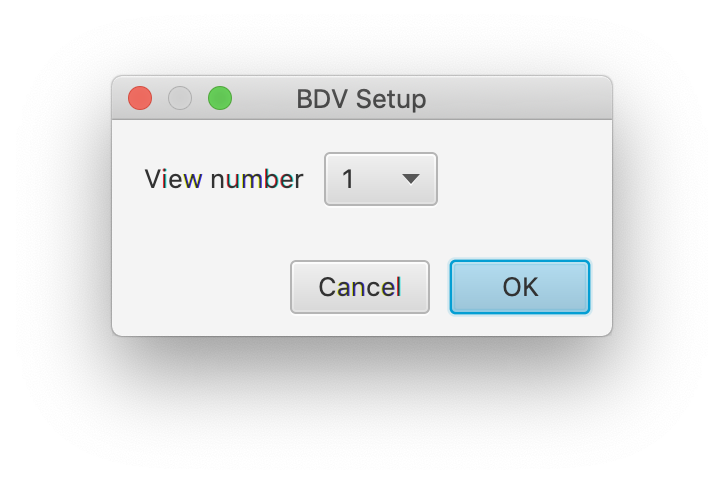
Now a connection between the MoleculeArchive and the file has been established the tracked molecule can be viewed in the original video. To do so, select a molecule of interest in Rover by selecting it in the ‘Molecule’ tab. Then open the video tool via Tools>Show Video in the top menu bar of Rover (see screenshot below). A dialog window opens. Select the number of viewing windows to be rendered. The position in these windows is correlated such that a selection of a different channel in each allows to look at the observed peak in multiple recorded colors. This can for example be used to study FRET single molecule data.
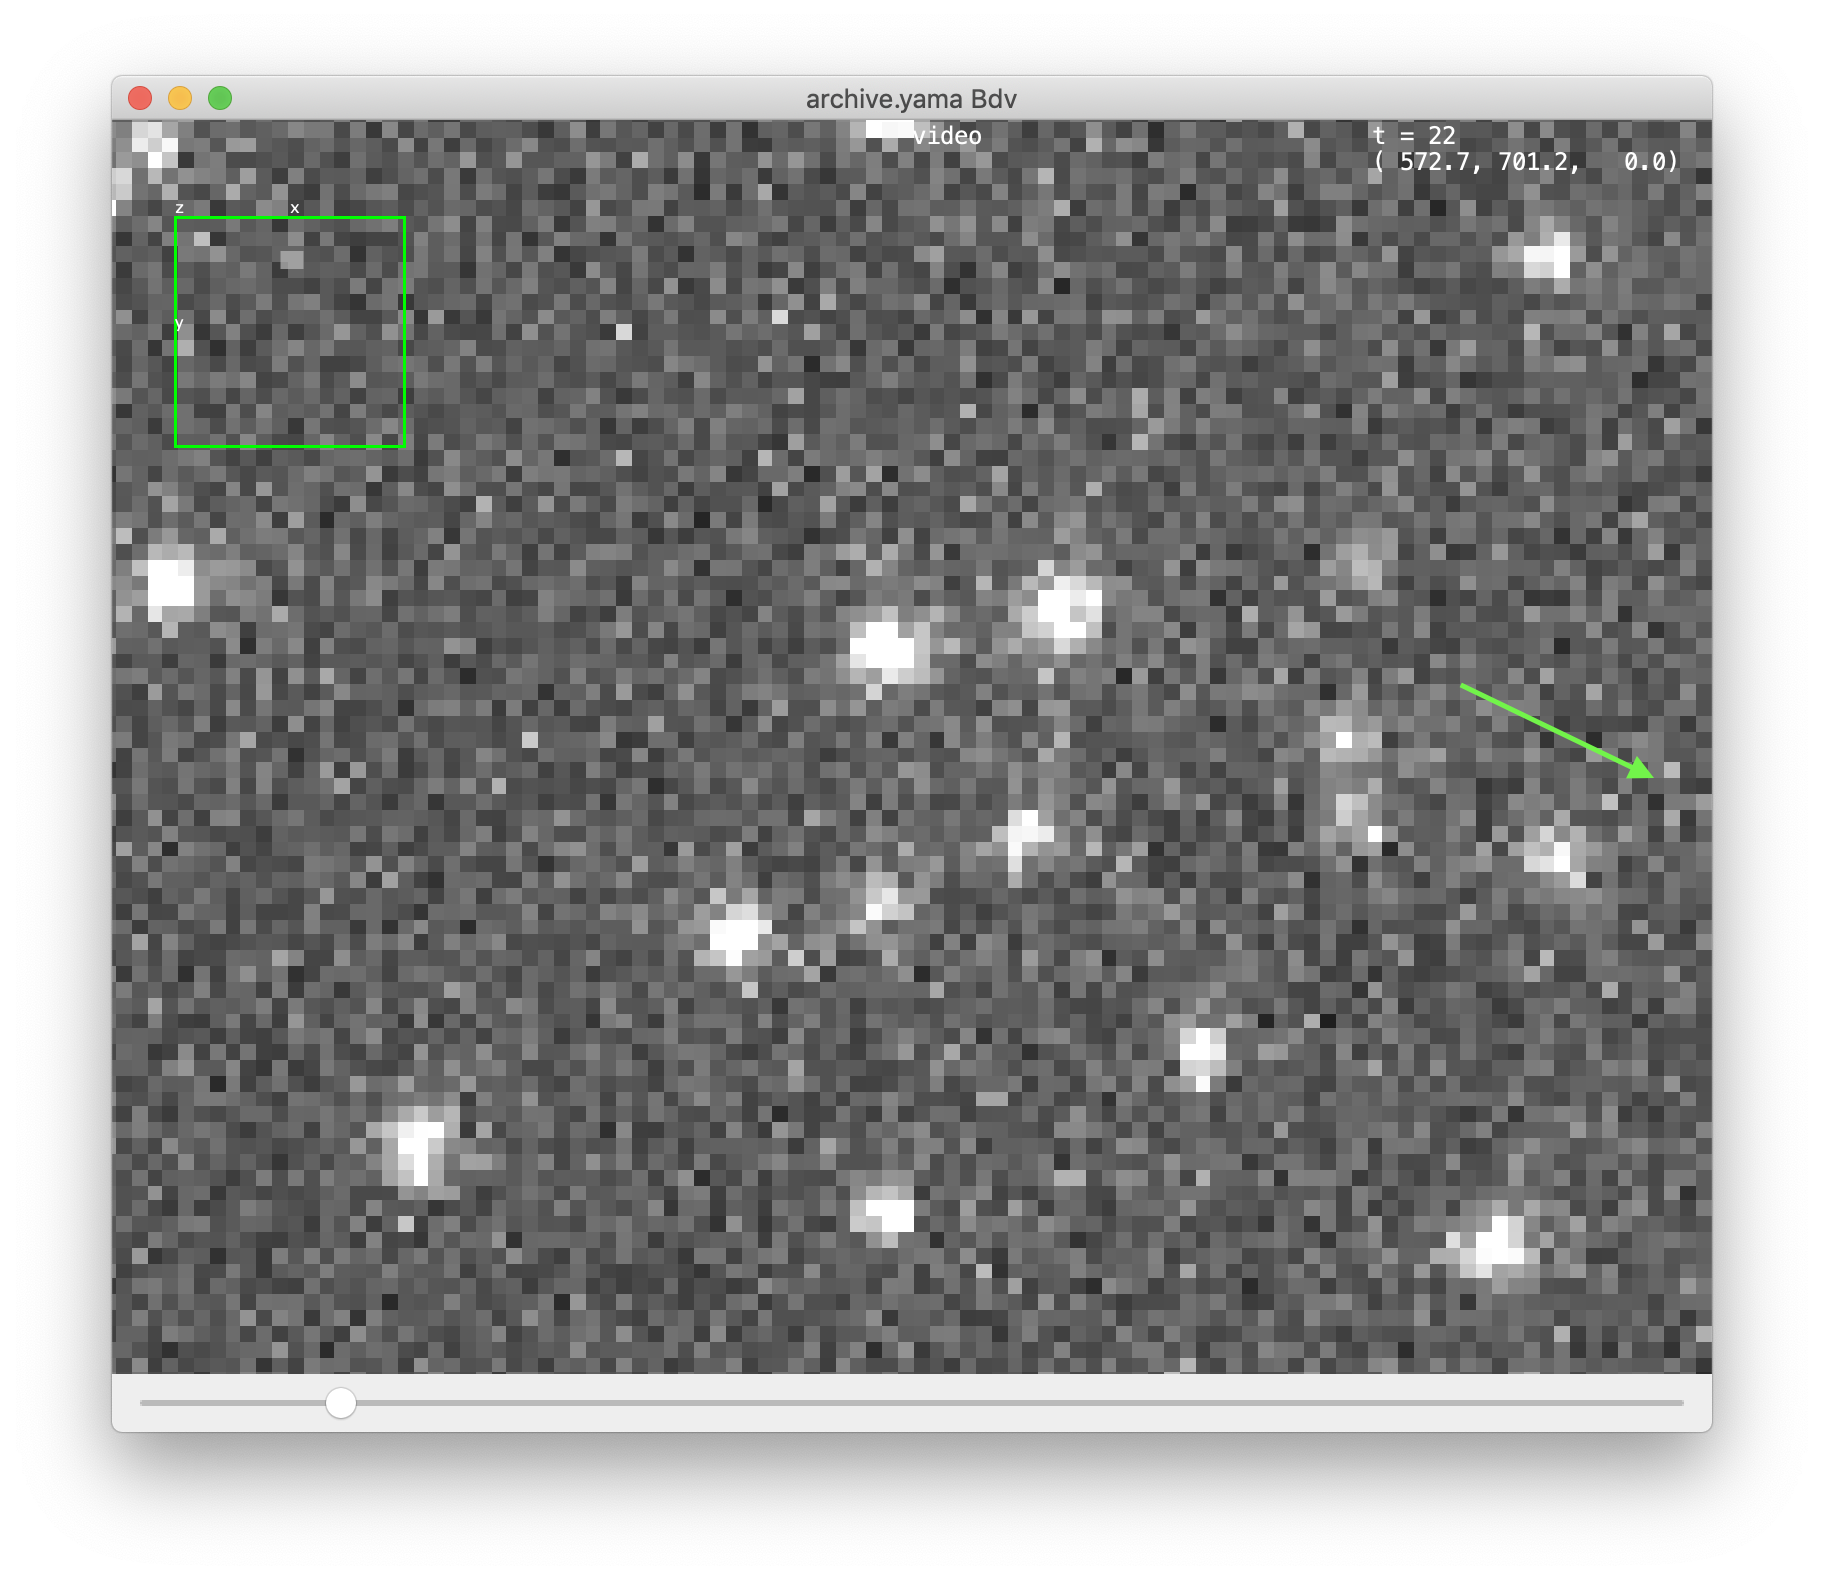
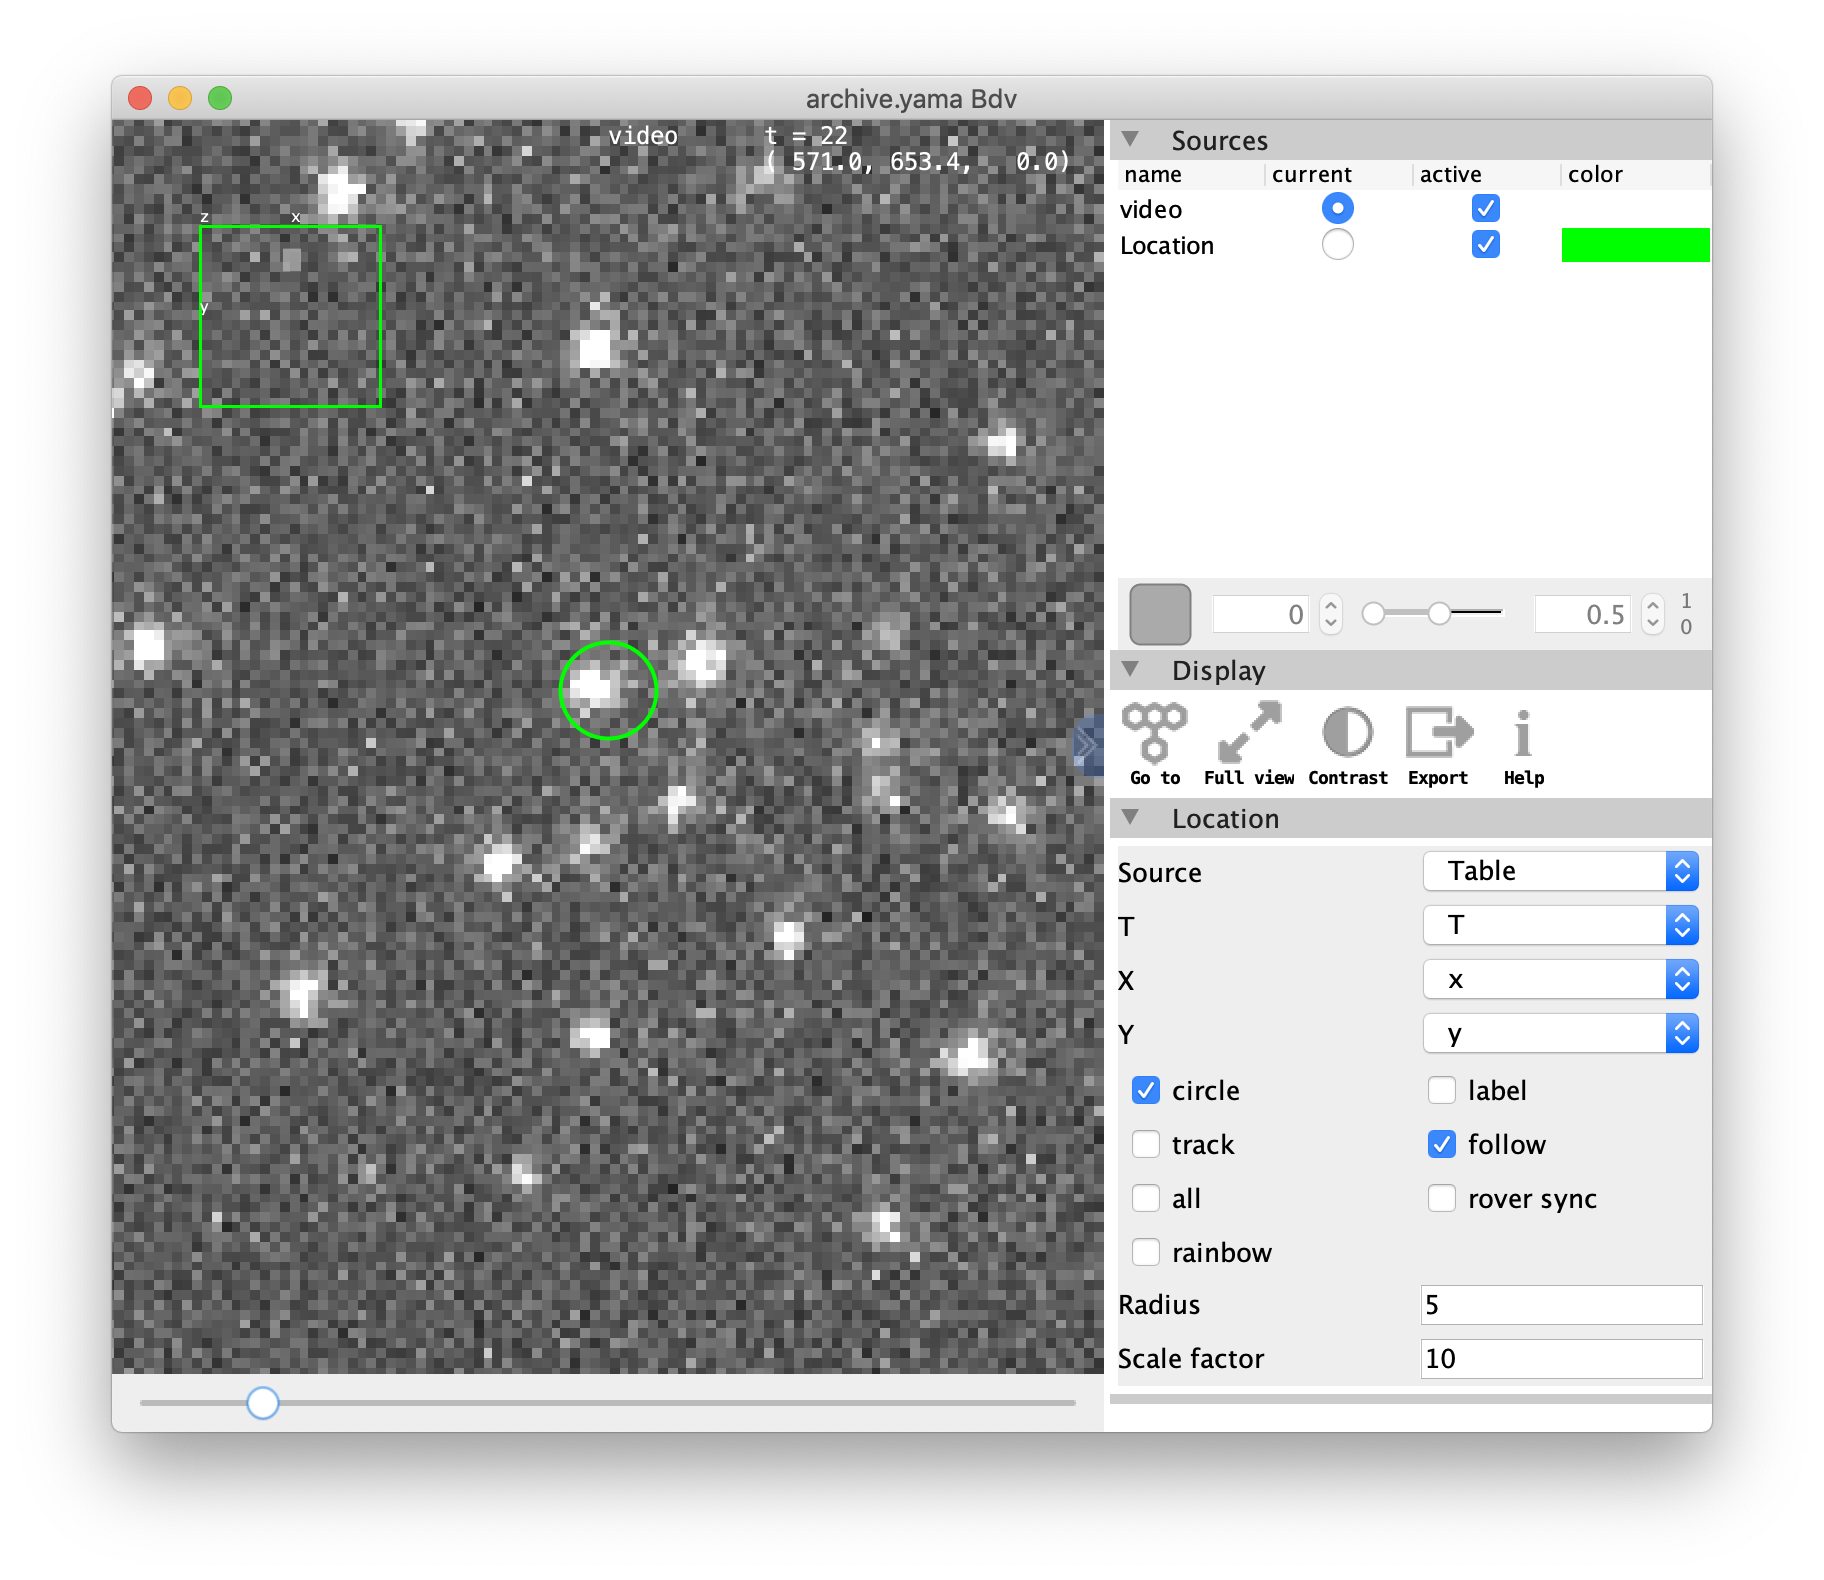
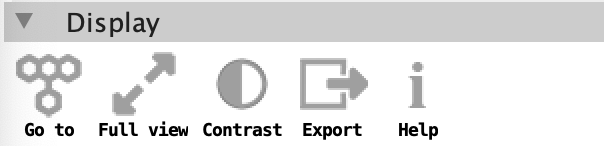
After pressing OK this opens the video at the position of the selected molecule. Move through the different time points with the slider below to see the movement of the molecule over time. Click on the right of the viewer on the « icon (see arrow) to show the settings menu. Here the current ‘channel’ can be selected under sources, display options can be found and settings can be provided on Location and Track.
How to work with this video
- Improving the contrast in the video: press the ‘Contrast’ button.
- Moving through different molecules: to look at different molecules in the video tick the box ‘rover sync’ in the Location section of the menu. Then keep this viewer window open and click on another UUID in Rover. The viewer now automatically moves to the new position.
- Label the molecule with a circle and/or tag: if there are plenty of molecules in one field of view, the selected UUID can be found easily when ticking the boxes ‘circle’ and/or ‘label’. Refresh the viewer by pressing the ‘Go to’ button in the Display section of the menu. Now a circle is placed around the current molecule and the first characters of the UUID are displayed.
note: to label all molecules in this way tick the ‘all’ box. Tick the ‘rainbow’ box to display all molecules in different colors. The radius and scale factor settings can be changed to change the appearance of the labels.
- Show the tracks of each peak: in the Track menu select the ‘track’ box to show the track of the respective molecule. Also select ‘label’ to display the first characters of the UUID.
note: to label all molecules in this way tick the ‘all’ box. Tick the ‘rainbow’ box to display all molecules in different colors. The radius and scale factor settings can be changed to change the appearance of the labels.
For more information on all BigDataViewer settings the reader is referred to the documentation page
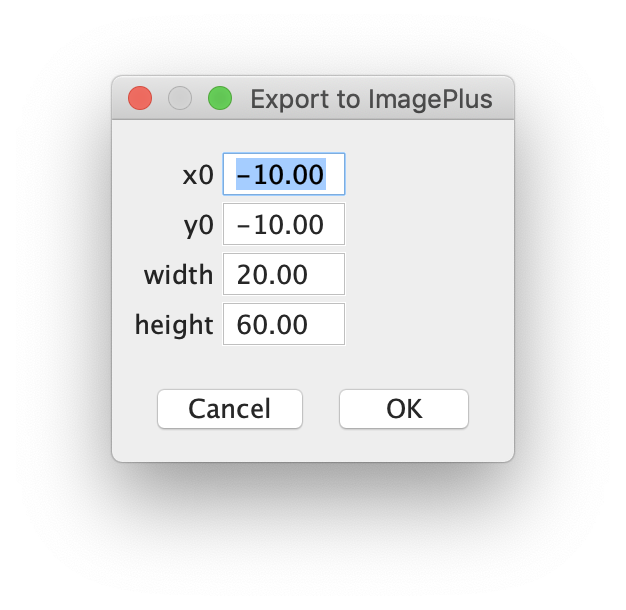
4. Export the Video
To save the video showing the molecule of interest use the ‘Export Video’ tool in the ‘Display’ menu on the side of the viewer. Stick with the default settings for the parameters in the popped-up dialogue and press OK.
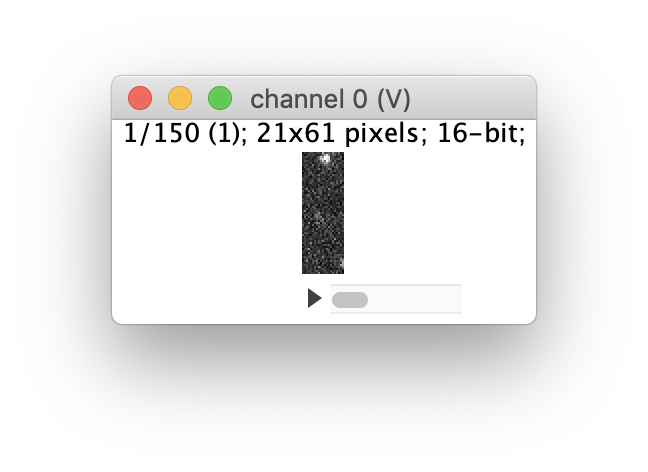
A new Fiji window will open with the exported video. Use the main Fiji functions to adjust f.e. the brightness of the video and save.
1 Pietzsch, T.; Saalfeld, S. & Preibisch, S. et al. (2015), “BigDataViewer: visualization and processing for large image data sets”, Nature Methods 12(6): 481-483, PMID 26020499