Let's Calculate the Variance - Tutorial
level: intermediate, duration: 5-10 min
This tutorial focuses on the calculation of the variance (var) in the traces obtained after running the “Peak Tracker” tool. To do so, a Molecule Archive .yama file with the data of the traces of interest is needed. To create such an archive, look at the tutorial Let’s Make a Molecule Archive. Alternatively, one can also use the tutorial file from the repository Testvideo_archive.yama.
1. Open the Molecule Archive (.yama)
First, open the archive using the “Molecule” tool (Fiji/Plugins/Mars/Molecule/OpenArchive). The Mars Rover GUI should show up.
2. Run the Variance Calculator
Now go back to the main Fiji environment and select the “Variance Calculator” from the Mars plugins (Fiji/Plugins/Mars/Molecule/Util/Variance calculator).
The following window will show up. Provide the settings as shown.
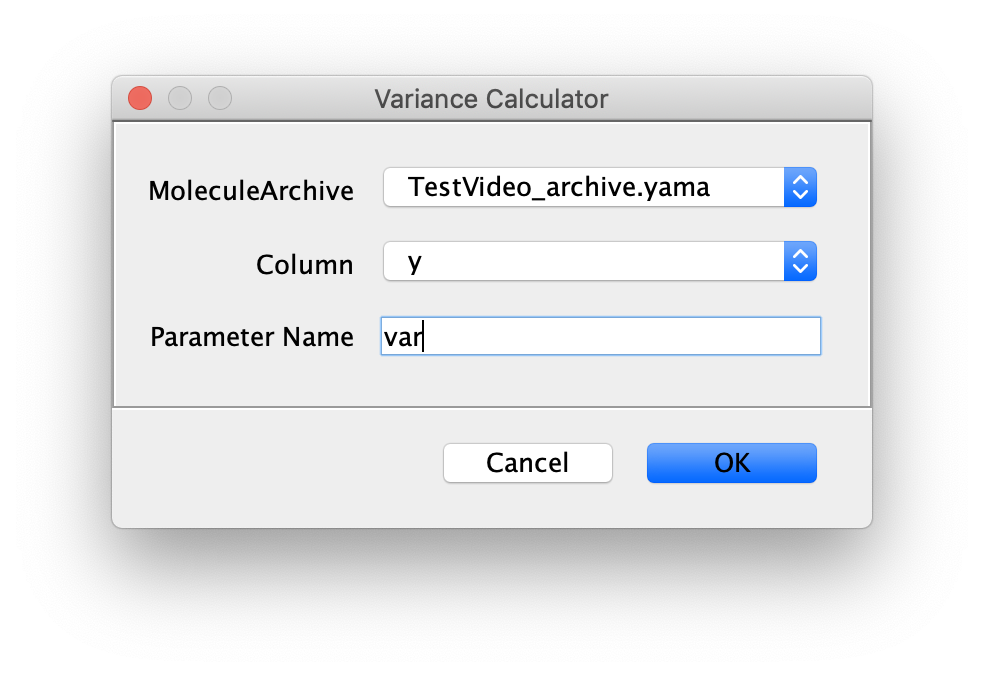
In the case of this example data set, the variance is calculated for the movement in the direction of the y-axis. Provide a parameter name and press OK. For more information about the experimental background of this example dataset go to the Let’s Make a Molecule Archive Tutorial.
3. Show the Results in Mars Rover
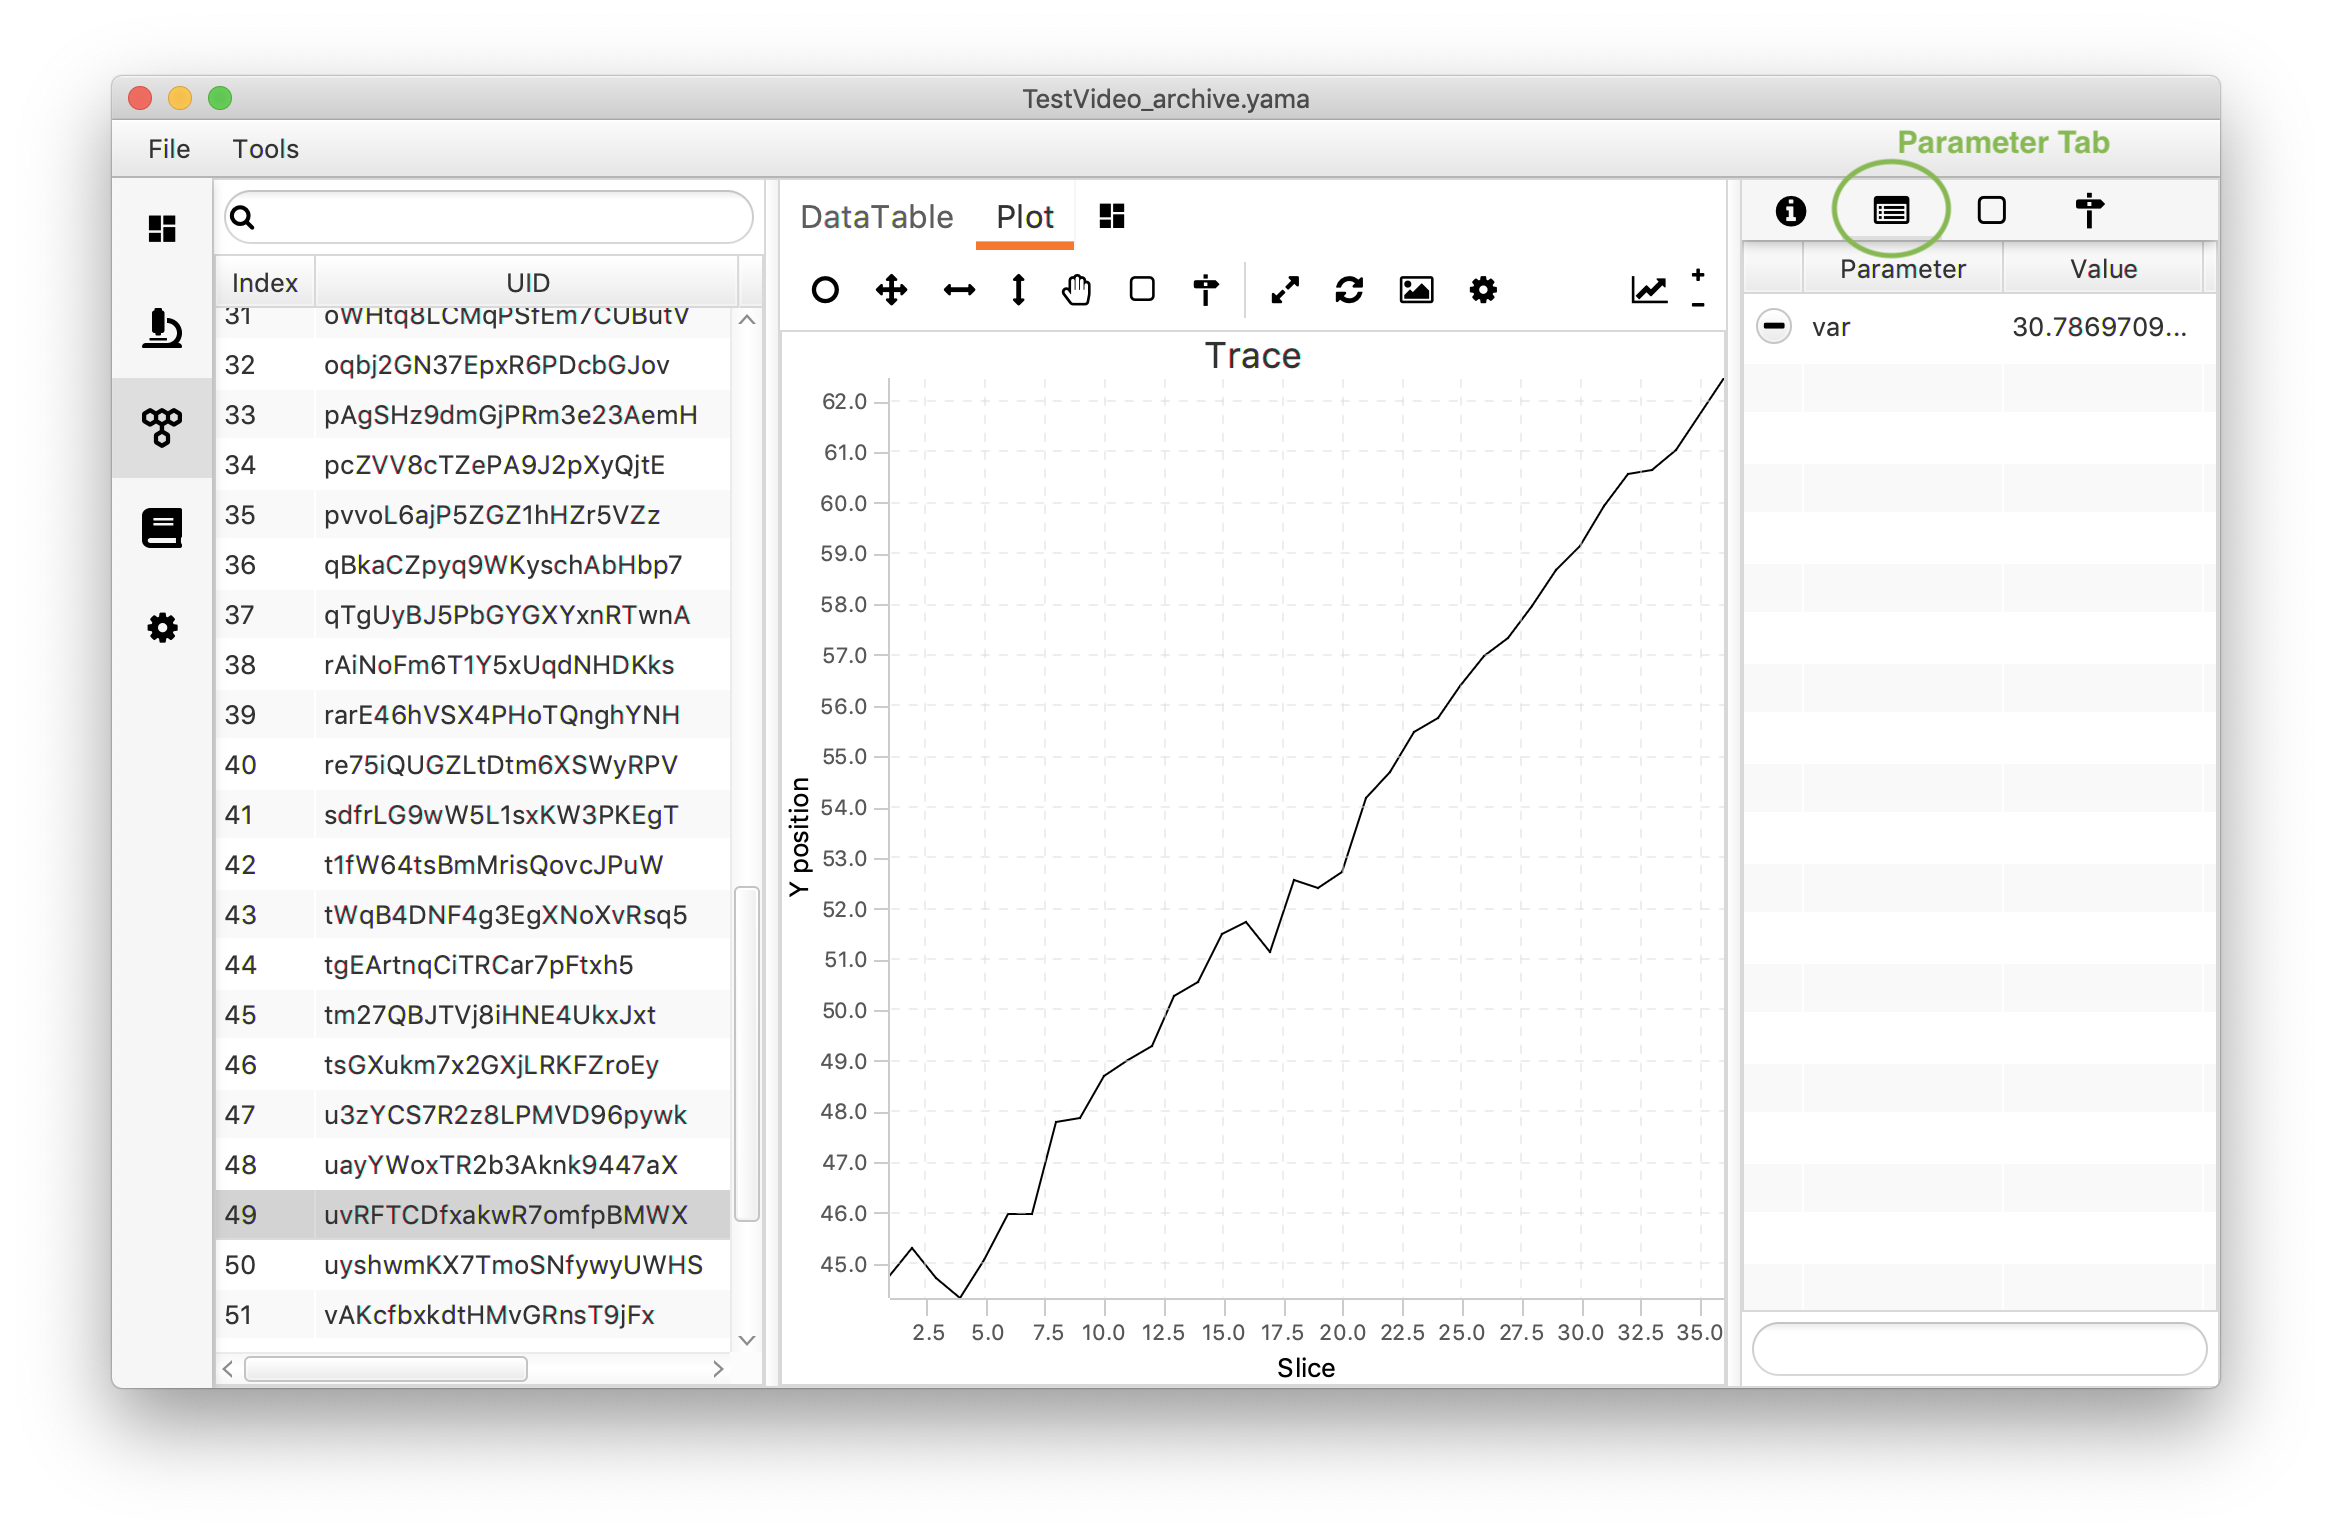
After the calculator has run go back to Rover and open any of the molecule UUIDs to show the plot. Next to the plot window a window with more options is found (f.e. for molecule tagging). Click on the parameters tab (next to the information icon on the top). This should show a list of obtained parameters - at this moment only showing the var parameter just calculated. Since the variance is a property of a trace one value is calculated per molecule (UUID).
When exploring the molecules two different populations are found: the population tagged “Active” with a high variance & the untagged population with a low variance. This is to be expected since active polymerase molecules are expected to travel a longer distance on the DNA than the molecules that are not active. In section 2 of the How to use Scriptable Widgets tutorial an explanation can be found to visualise these two populations in a histogram on the Rover dashboard.
Now save the archive again to retain the calculated values.
To further analyse the variance values f.e. by means of plotting, have a look at the How to open a Molecule Archive in python and the How to use Scriptable Widgets tutorials.