Rover Dashboard
The Rover Dashboard gives an overview of the data collected in the Molecule Archive. Widgets can be selected from the toolbar with a click. The scripting language can be switched between Groovy or Python in the drop down menu and all widgets can either be cleared from the desktop (bomb icon), stopped loading (square) or refreshed (refresh button) simultaneously.

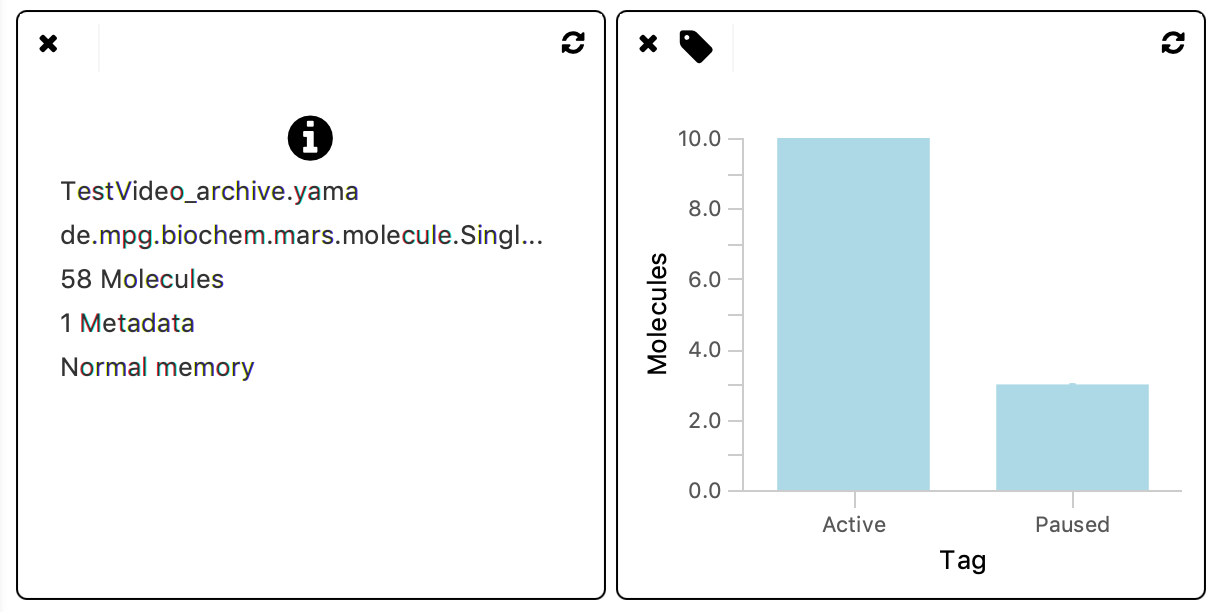
Predefined widgets

The predefined widgets give a first glance at the data. The information widget shows the name of the archive, the archive type, the number of molecules in the archive, the number of metadata files and which type of memory is used for storage (‘Normal’ or ‘Virtual Mode’). The tag widget shows a bar plot of the number of molecules that are categorised by a certain tag. Update the widgets after a change in the archive by pressing the refresh button.
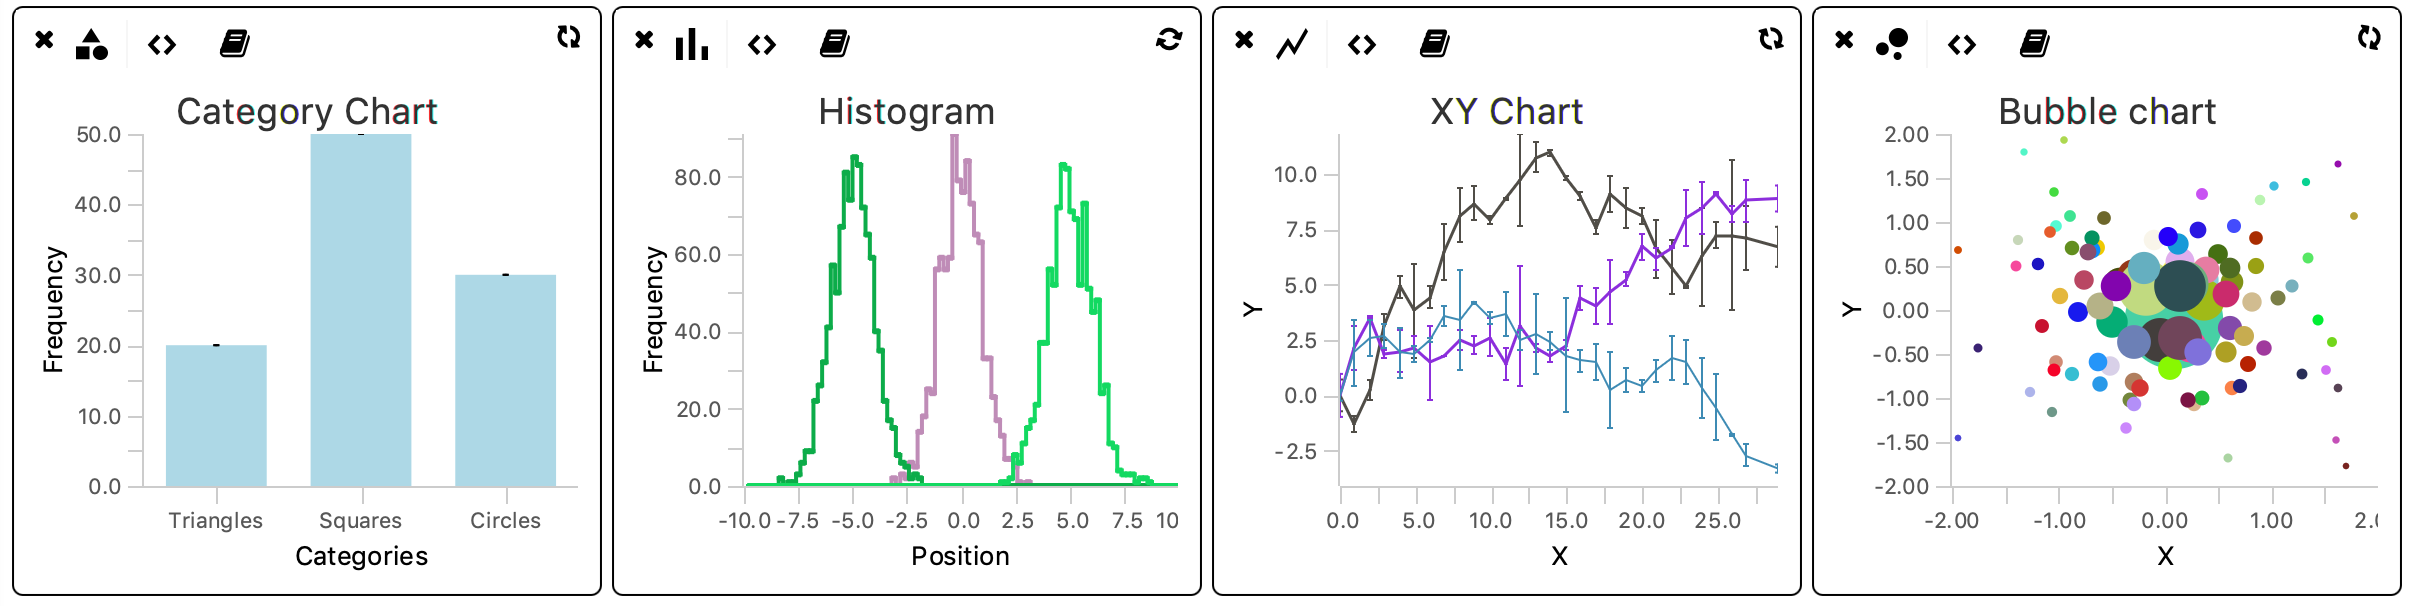
Scriptable widgets

The scriptable widgets are available on Rover Dashboard and also in the ‘Experiments’ and ‘Molecules’ tabs. They allow for a rapid evaluation of the archive, metadata, and molecule features. All scriptable widgets (‘Category Chart’, ‘Histogram’, ‘XY Chart’, ‘Bubble Chart’, and ‘Beaker’) leverage the scripting capabilities of ImageJ to provide limitless customisability. Scripts can be written in Python or Groovy.
Extended documentation on the scripable widgets is provided as well as a tutorial with examples on the scriptable widgets.