Flow Magnetic Tweezers Workflow
Quick summary
Topoisomerases mediate DNA topology during different processes, like DNA replication and transcription, and are important to compact DNA. DNA gyrase from E. coli is an example of such a topoisomerase. In this example, the interaction between gyrase and DNA is studied using a flow magnetic tweezers set-up (a combination of magnetic tweezers and a flow stretching assay). The huge dataset is analyzed using Mars highlighting its ability to sort and store tracking information, parameters, and filtering tags in a highly reproducible manner.
The example gives an overview of how a real data set would be analyzed with Mars starting from tracking single molecules, sorting the traces by calculated features, over to producing a final publishable plot. Next to this, the scripting feature in Fiji is used to calculate parameters in an automated fashion.
Table of contents
- Background information
- Tracking of the single molecule data
- Add regions for different activities to the archive
- Classification using groovy scripts
- Export data and plot with python
- Conclusion
Background information
Before the in-depth analysis starts a general background about the experiment is given. For a very detailed description of the experiment and the set-up please refer to our publication: ‘Multiplex flow magnetic tweezers reveal rare enzymatic events with single molecule precision’ (Agarwal, R., Duderstadt, K.E., Nat Commun 11, 4714 (2020).)1.
The flow magnetic tweezers set up
The method used is a novel force spectroscopy technique called ‘flow magnetic tweezers’1 (FMT). In FMT experiments, a magnetic tweezer setup is combined with a flow stretching assay. In this way, stretching and shrinking movements of DNA molecules are observed in the x-direction instead of the z-direction as is the case in classical magnetic tweezer experiments. This allows for the imaging of up to tens of thousands of molecules at the same time while retaining single-molecule resolution. Consequently, the ability to measure so many molecules at once makes the analysis of FMT datasets very challenging due to their size and complexity.
In this experiment, individual DNA molecules tethered to a microscope slide are stretched by a combination of lateral and vertical forces from flow and magnetic tweezers, respectively. During the experiment, DNA molecules are probed by changing the flow and are supercoiled through the application of torque using magnet rotation.
Gyrase
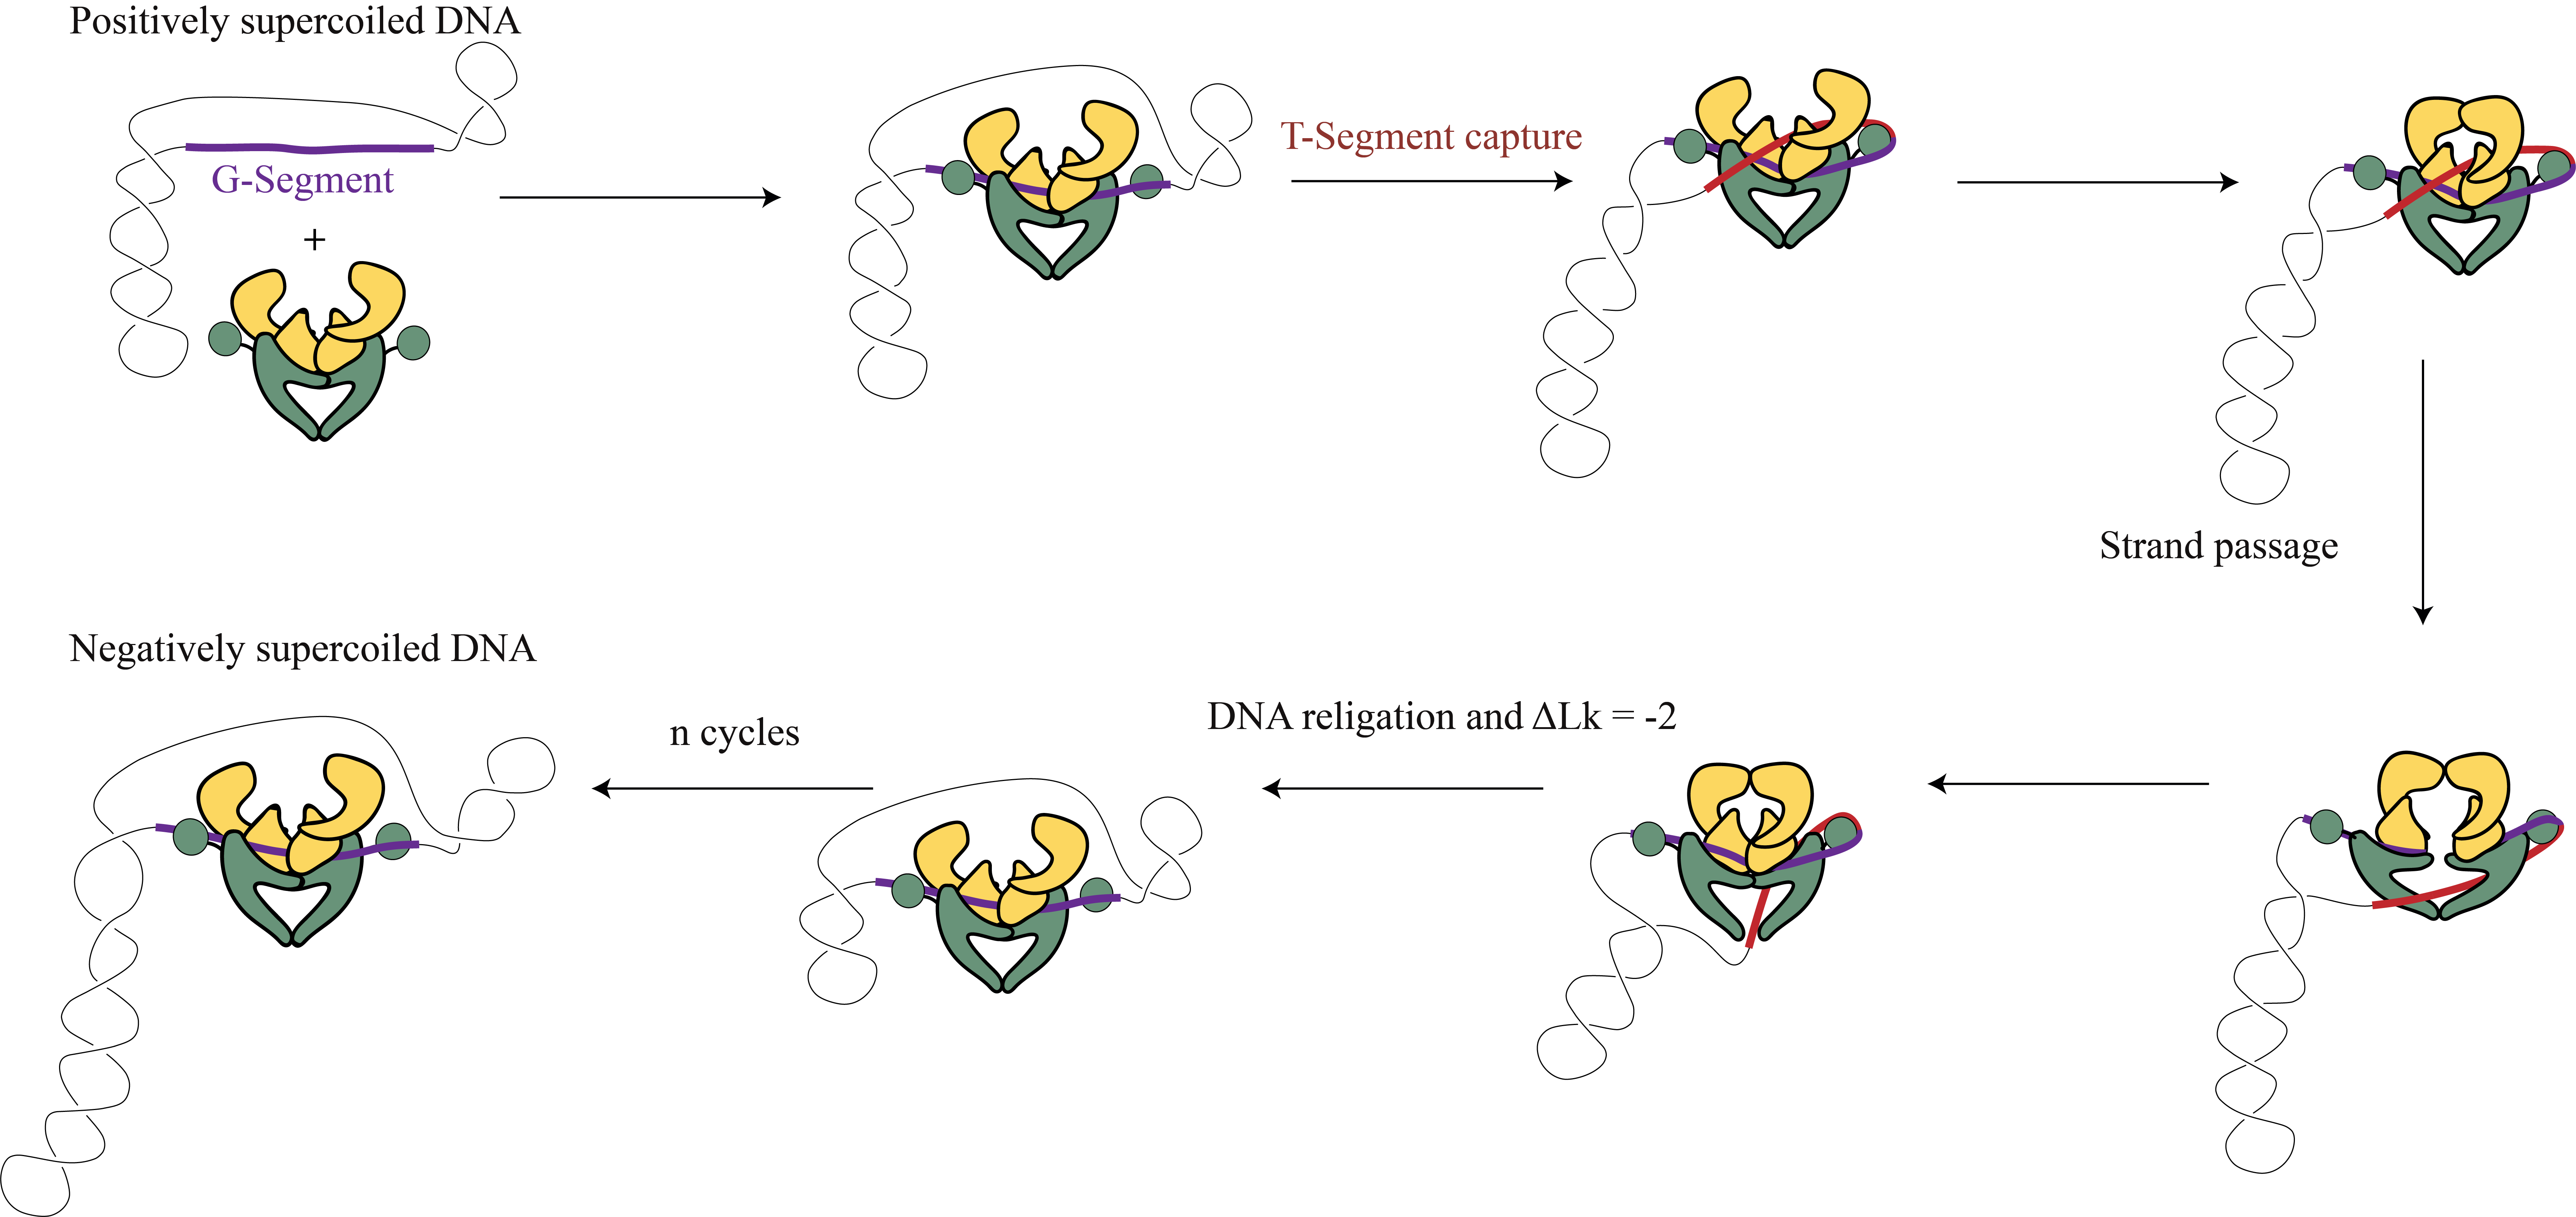
Gyrase is a bacterial enzyme that maintains the topology of chromosomes and thereby facilitates important processes like DNA replication and transcription (Nöllmann et al., 2007)2. It does so by opening the G-segment (gate) and passing the T-segment (transfer) through it and religating the DNA G-segment. This results in a -2 change in linking number. In the cell, gyrase using energy from ATP to resolve positive supercoils and introduce negative supercoils as shown in the figure. This function is very important to compact the chromosome inside a cell and to mediate the topological stress during transcription and replication. The figure below illustrates the cycle of gyrase.
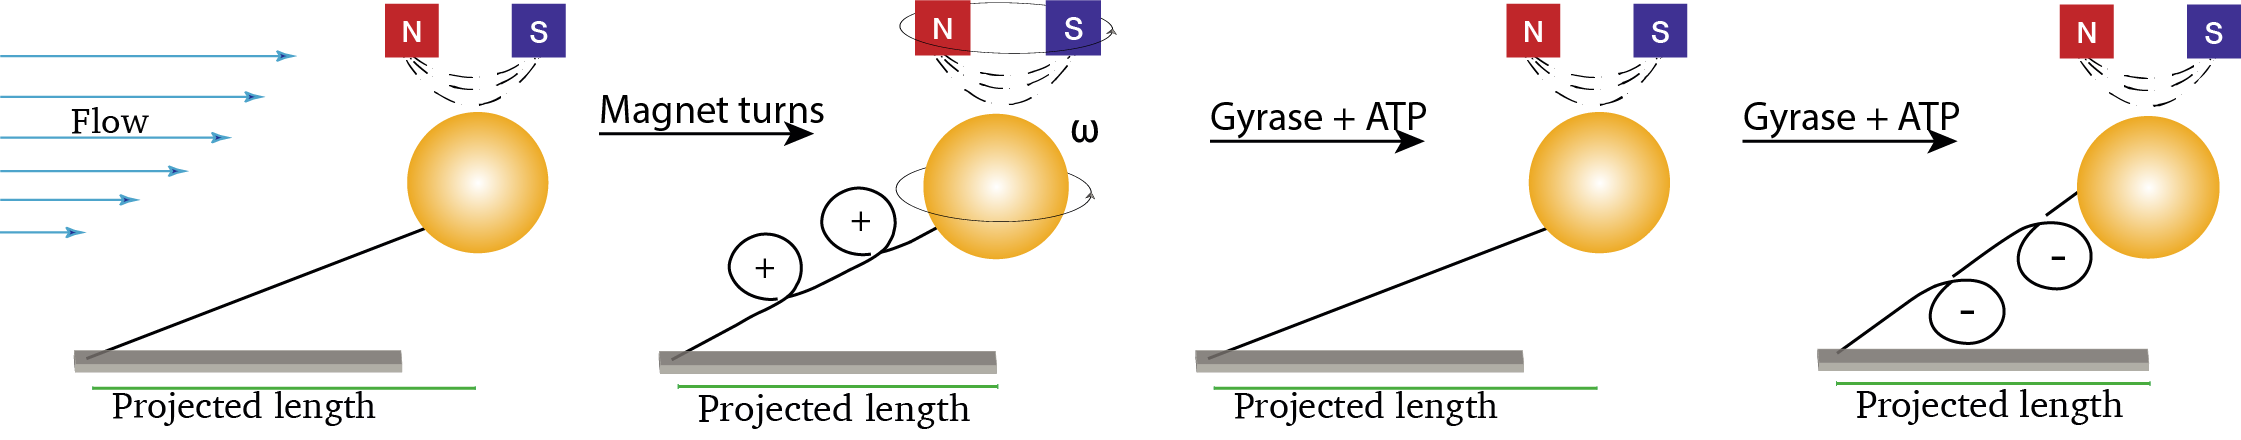
The assay
To study the interaction between gyrase and DNA, DNA molecules are tethered to a functionalized glass slide surface and on the other side to a super-paramagnetic bead. These beads are rather large and can be imaged and tracked easily. The molecules are under a constant flow resulting in a drag force on the molecule. At the same time, there is also topological control of the DNA molecule as the bead is trapped in the magnetic field of the antiparallely mounted block magnets. When rotating the magnet, turns (positive and negative) can be introduced in the DNA similar to what would happen during biological processes on DNA. Furthermore, the direction of the flow and the (drag) force can be changed by regulating the flow. Both features are used in different combinations to find out different properties of the DNA. An in-depth discussion of specific DNA characteristics probed in this experiment can be found here.
The following figure illustrates the main experimental idea. DNA is positively supercoiled by turning the magnet on top. Next, after the addition of gyrase and ATP, the positive coils are resolved and negative supercoils are introduced. The timing and velocity of this process are monitored and analyzed throughout this example.
The Mars workflow
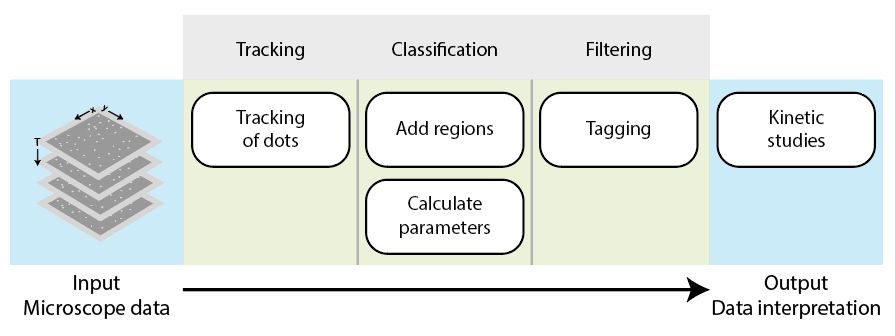
To analyze the generated dataset, the single molecule beads are tracked using the build-in tracker from Mars (Peak Tracker). A ‘MoleculeArchive’ is created containing all the tracking information of every single molecule. This archive is the center of the analysis and will keep track of all calculated parameters, tags, and applied filters overtime to ensure reproducibility. Parameters are calculated using scripts (e.g. groovy based) for different time points of the trace to be used later on to classify molecules with tags. A selection of molecules with certain tags can then be used for further analysis. Tables can be exported with specific information which can then be used in combination with other plotting tools (e.g. python) to create great data representation or with other software to analyze the data further. Keep in mind that this workflow is a result of extensive work.
Tracking of the single molecule data
The scripts for analyzing the dataset can be found in this GitHub repository. It will be indicated which script is used for which part of the analysis. The video original video is available but the peak tracking needs a lot of computational power and will run for a long time. You can check out the fully analyzed virtual archive here.
Importing the video in Fiji
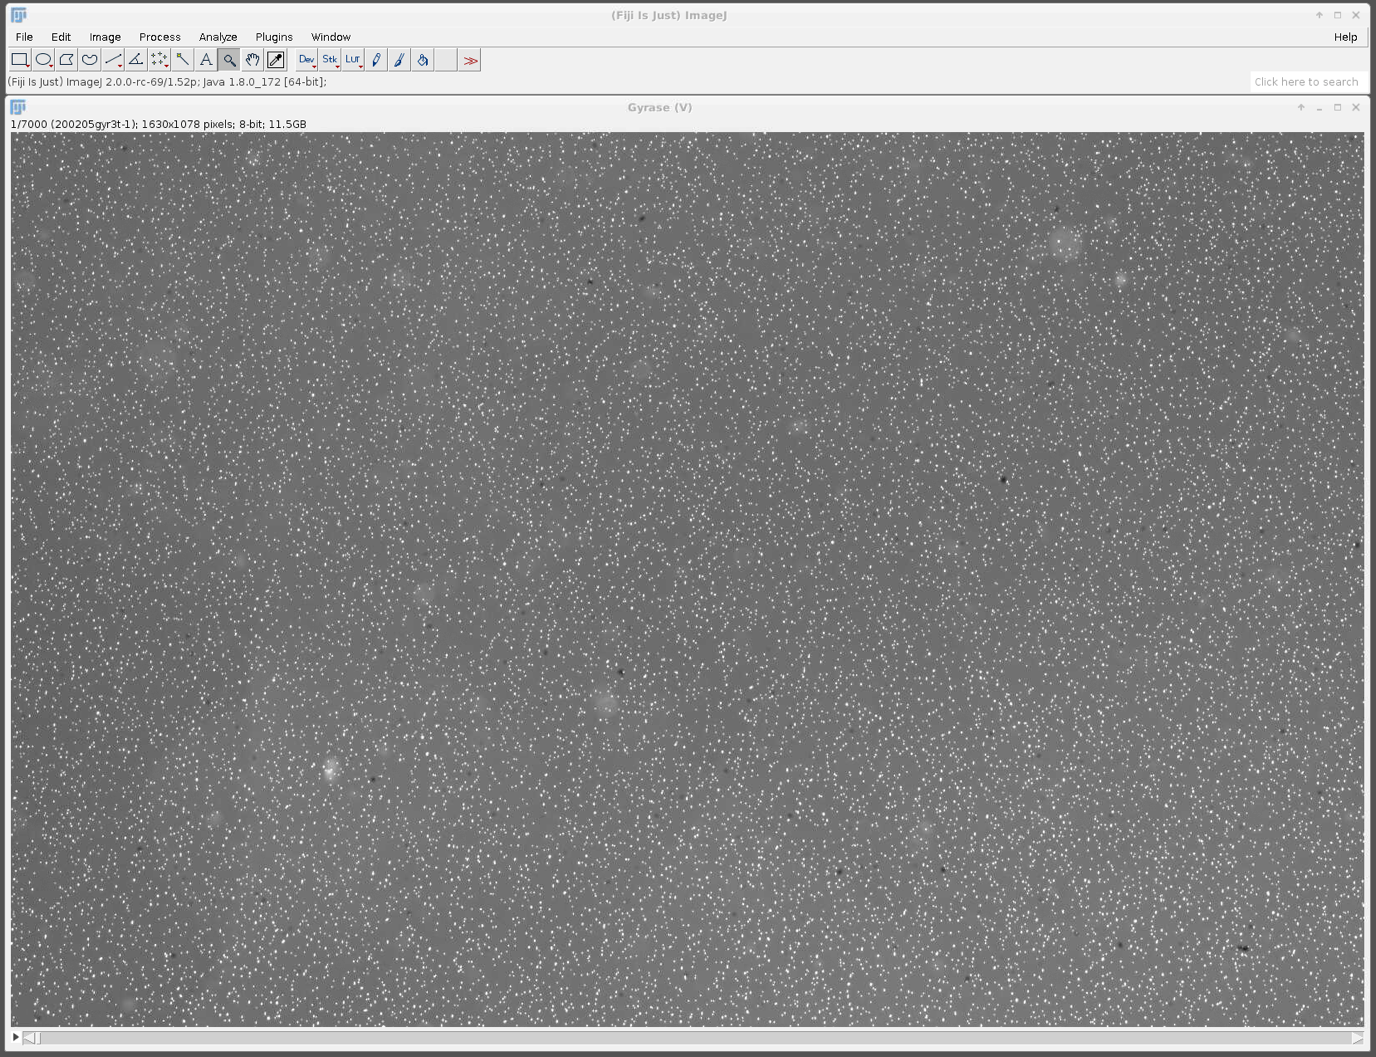
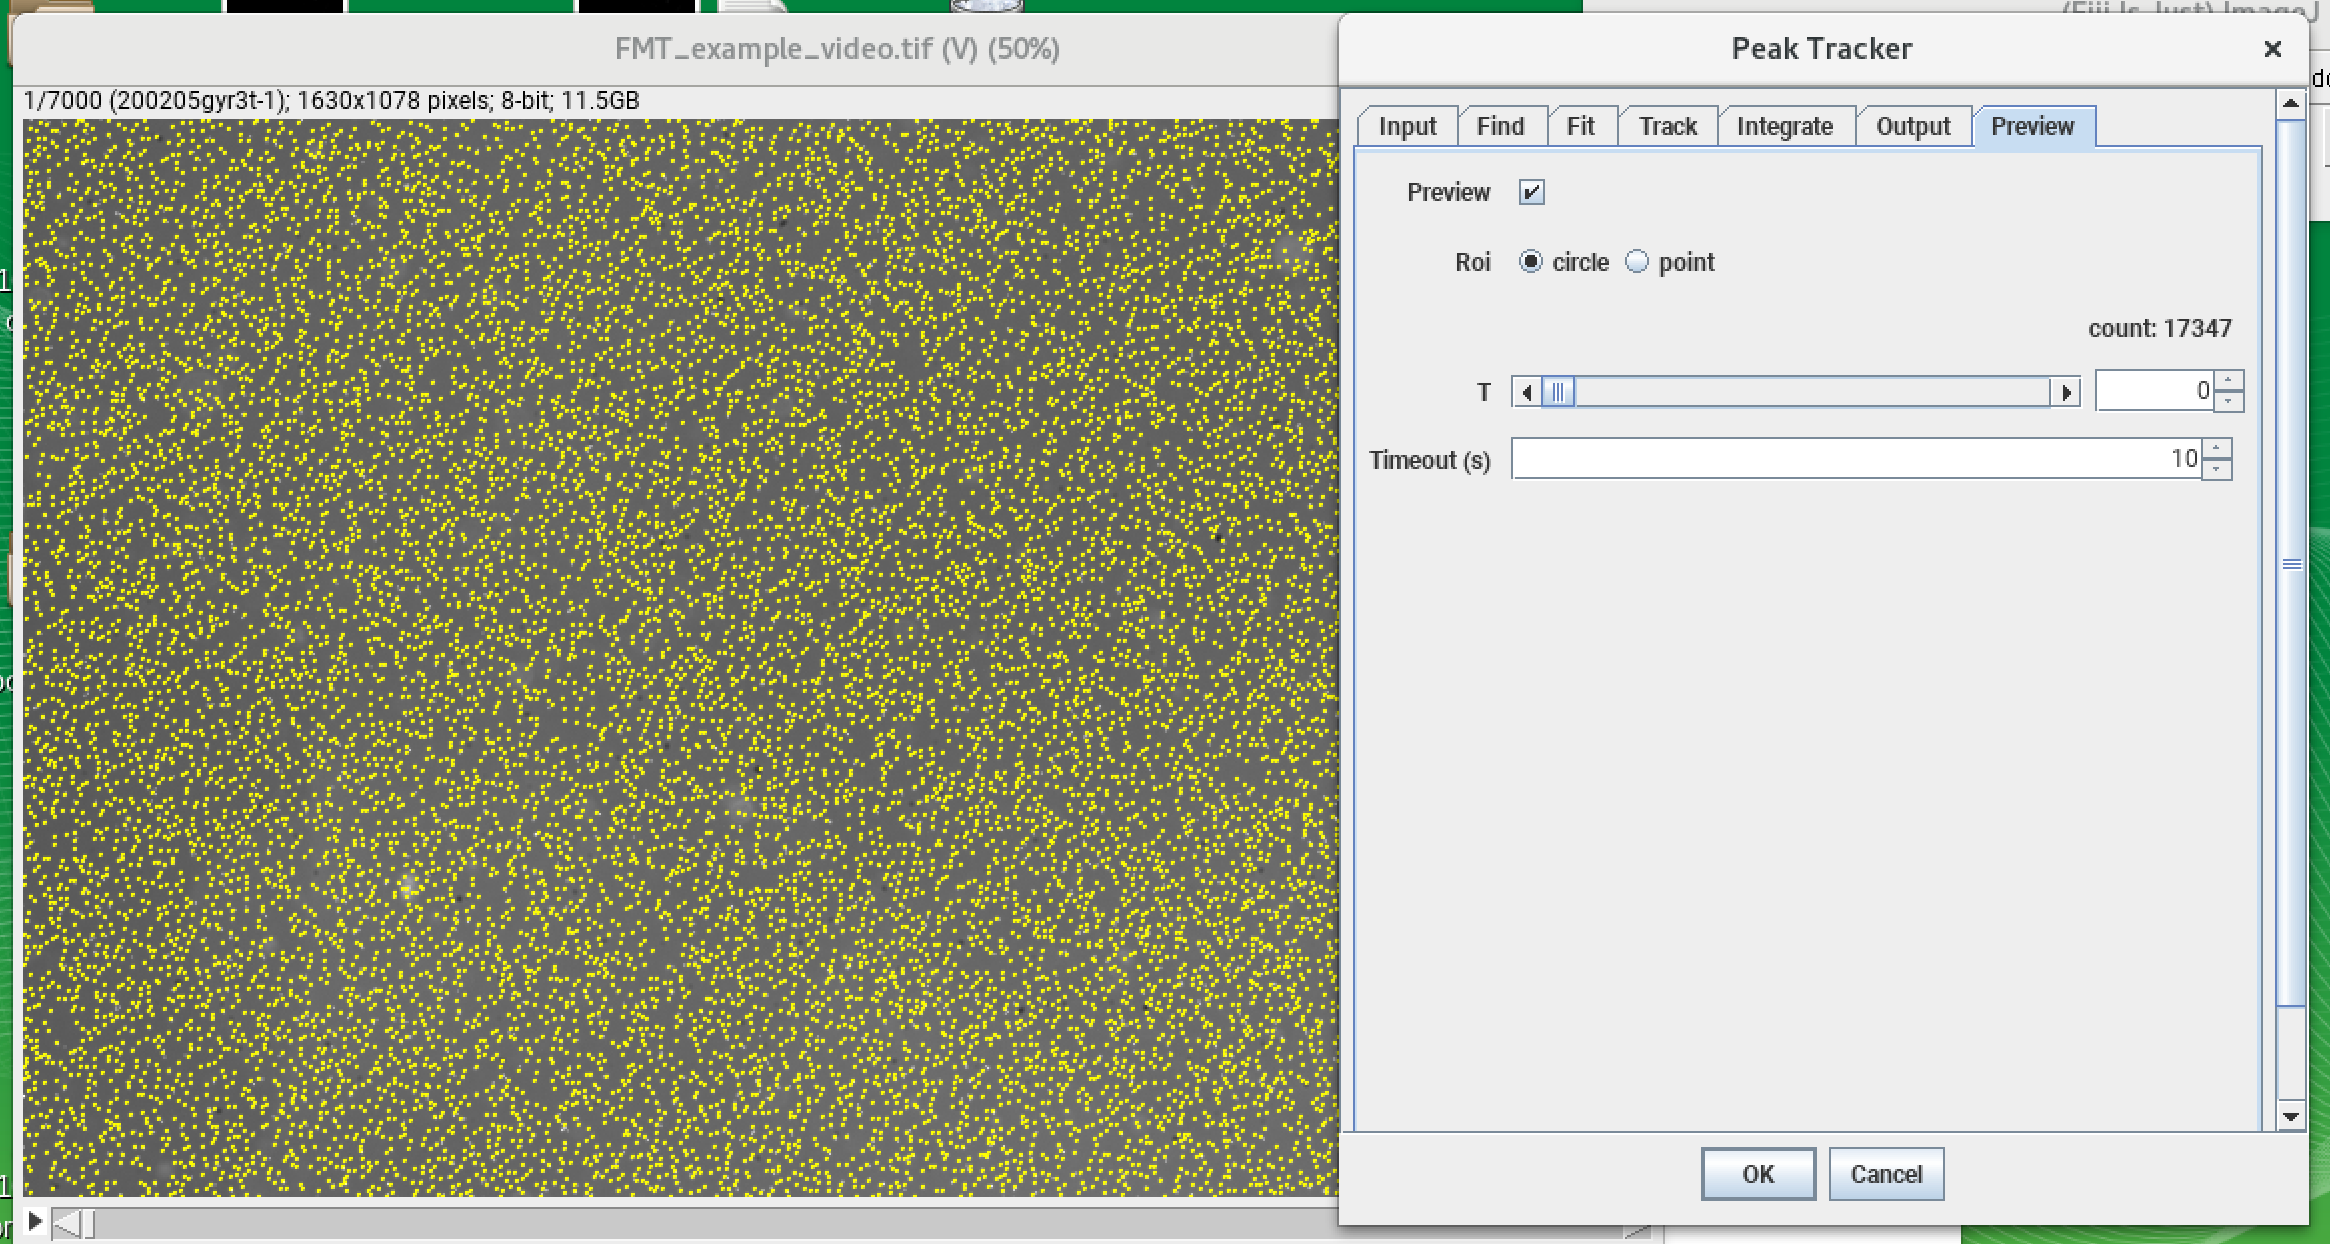
The file (TIF video) is imported to Fiji (the file can be accessed using this link: FMT_Example_Video.tif ![]() ). A smaller video with only a segment of the total field of view from a gyrase experiment is provided here. The white pixels in the field of view represent the magnetic beads and can either be single DNA-bead tethers, multiple DNA-bead tethers, or beads stuck on the surface.
). A smaller video with only a segment of the total field of view from a gyrase experiment is provided here. The white pixels in the field of view represent the magnetic beads and can either be single DNA-bead tethers, multiple DNA-bead tethers, or beads stuck on the surface.
Opening tracker from Mars plugin
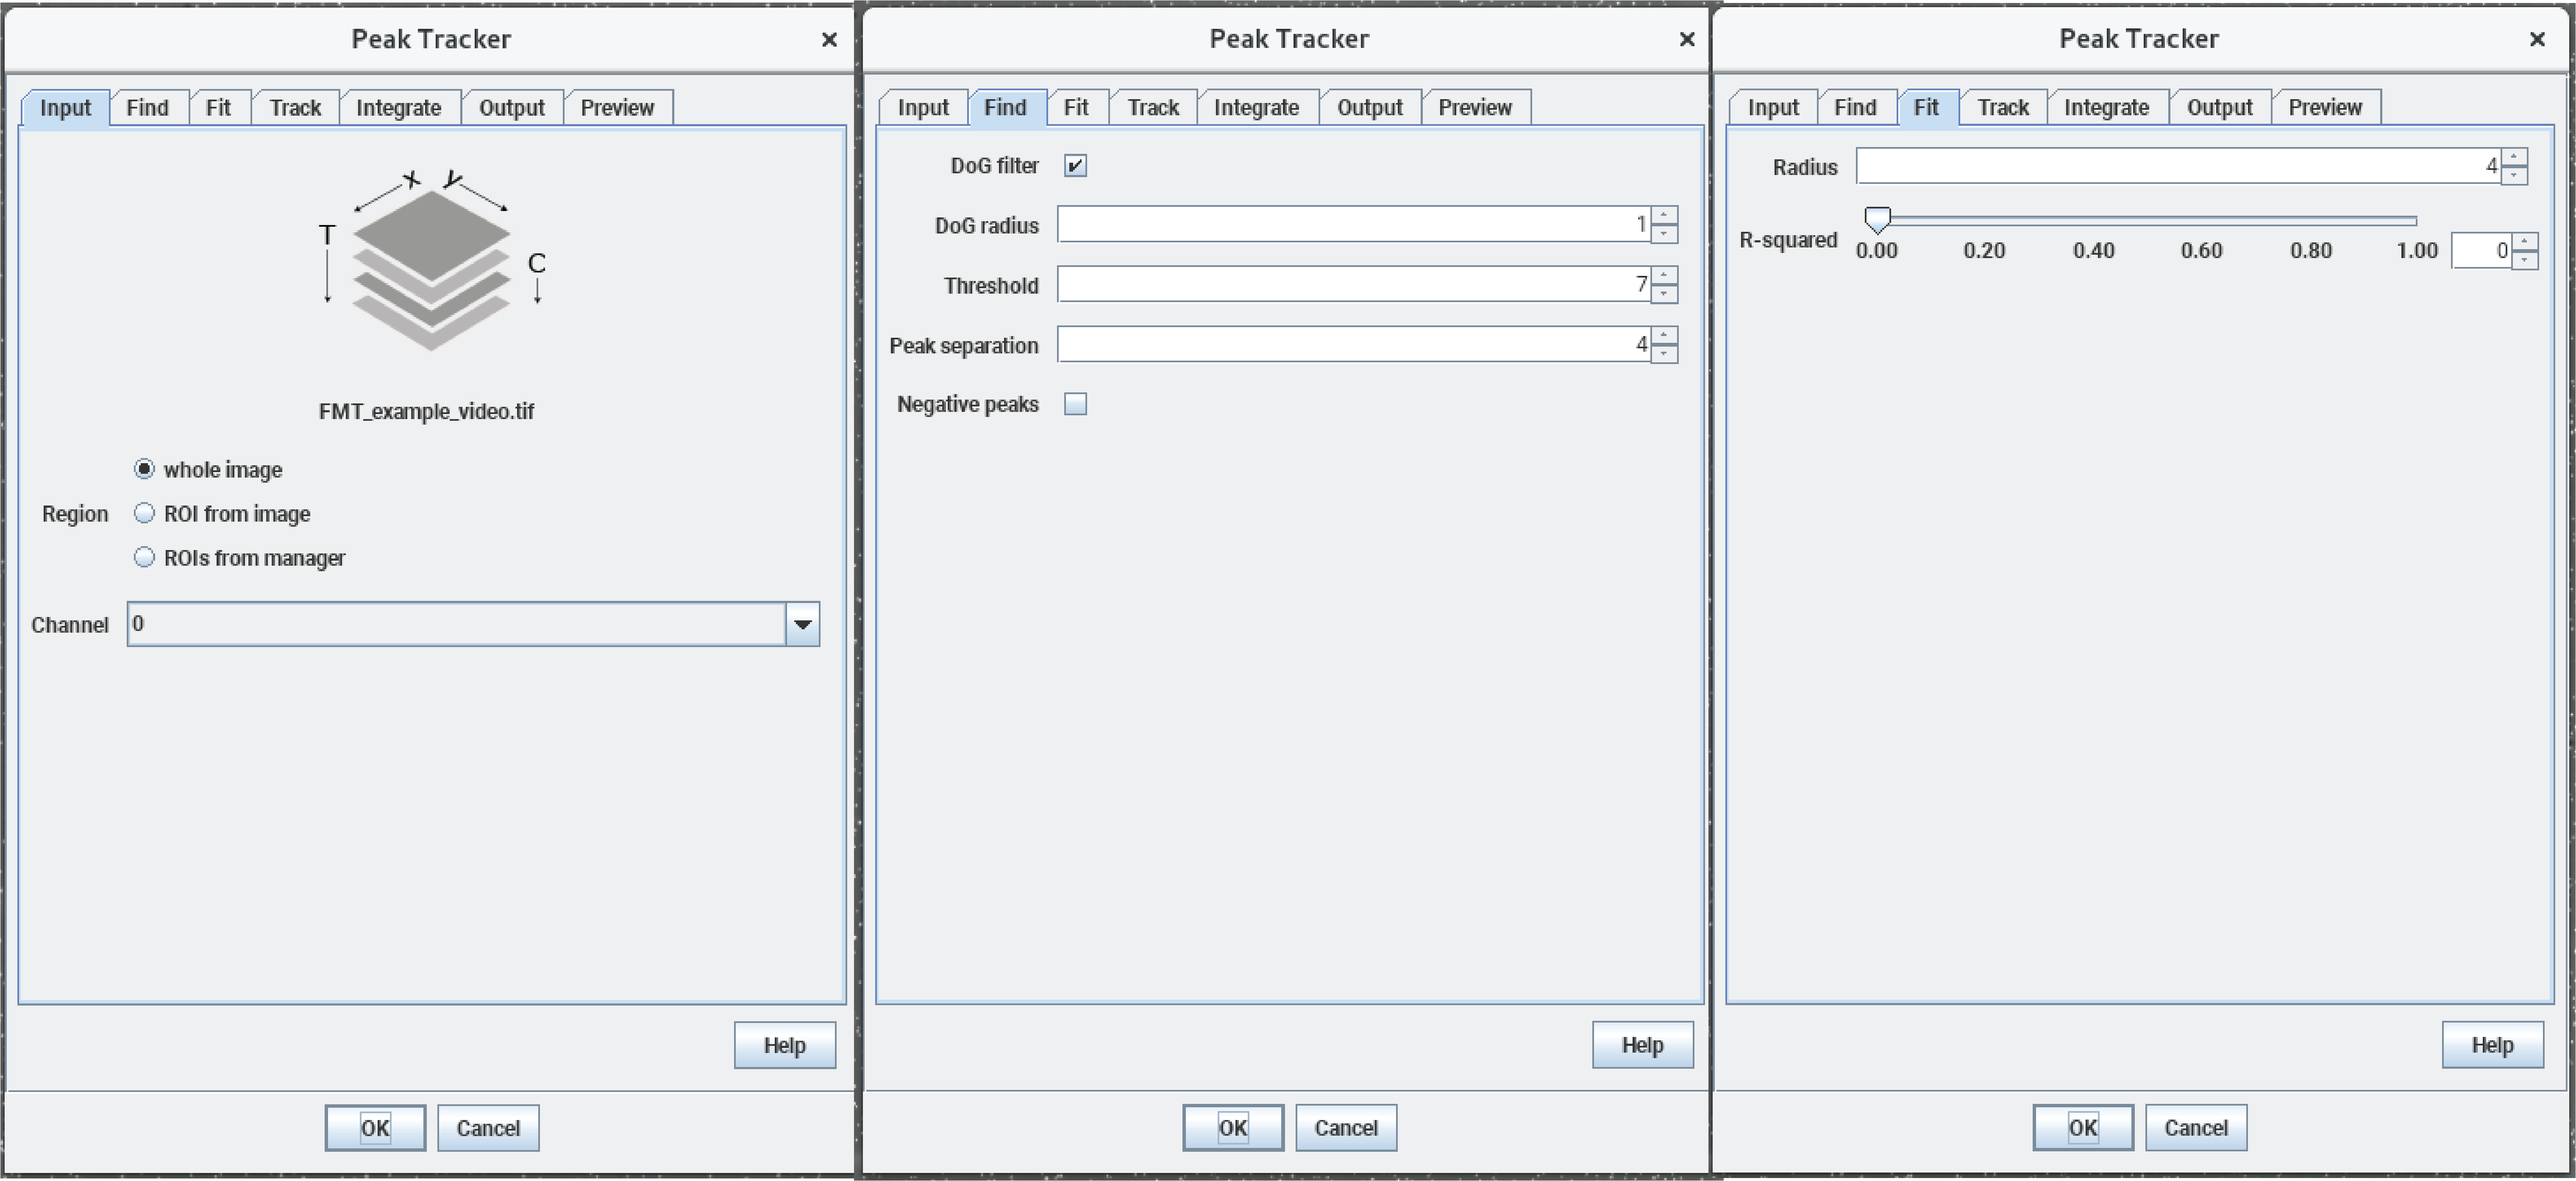
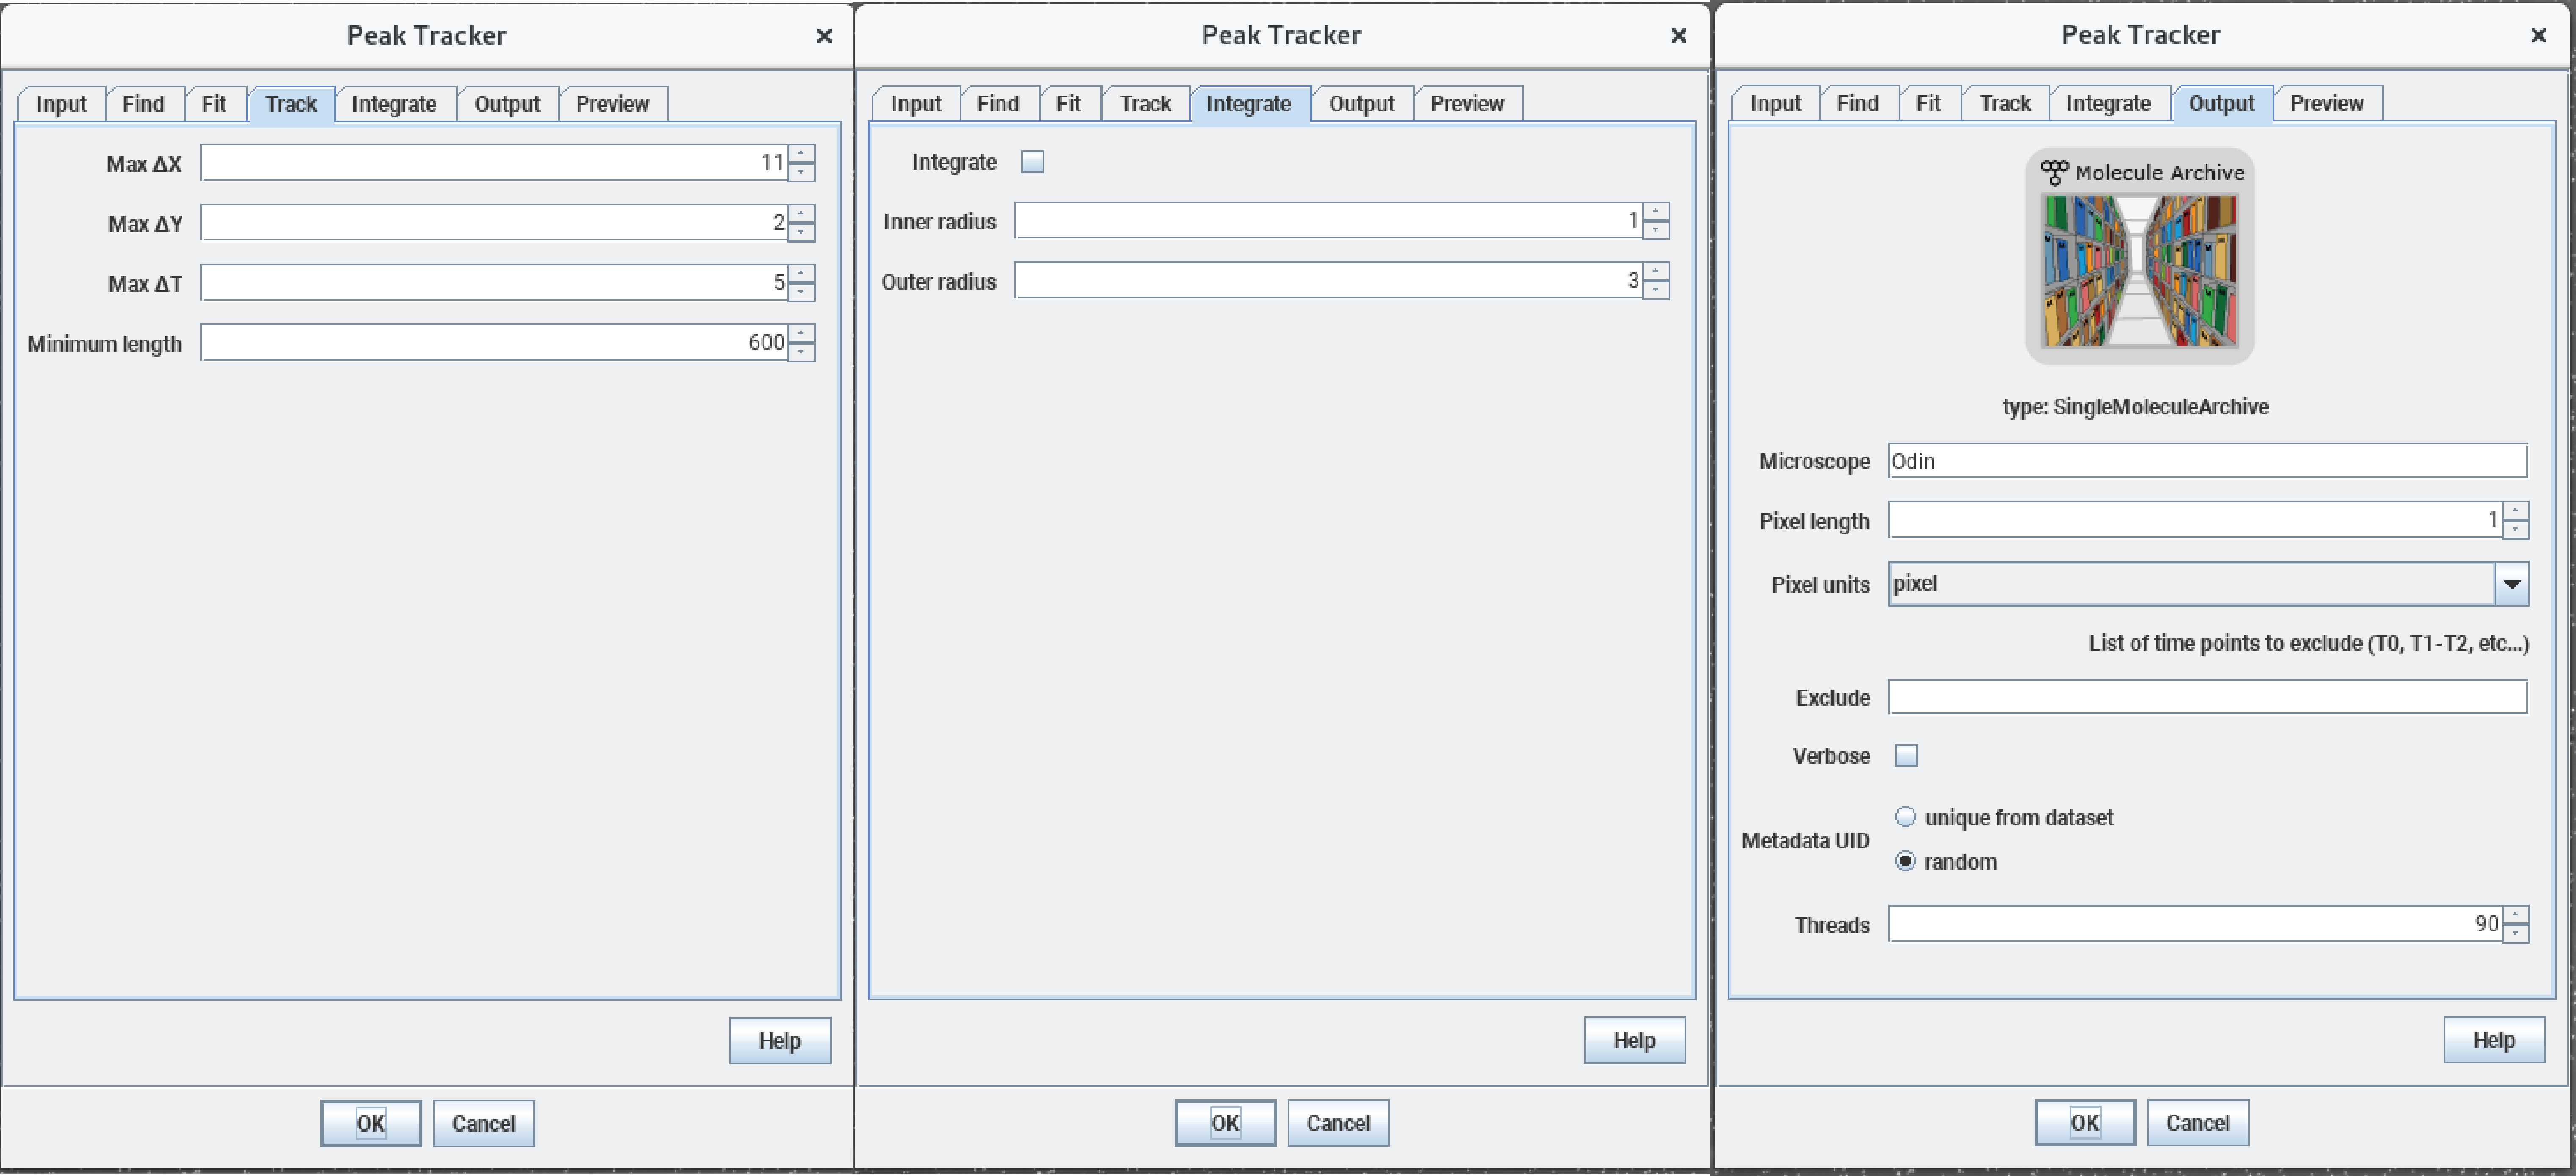
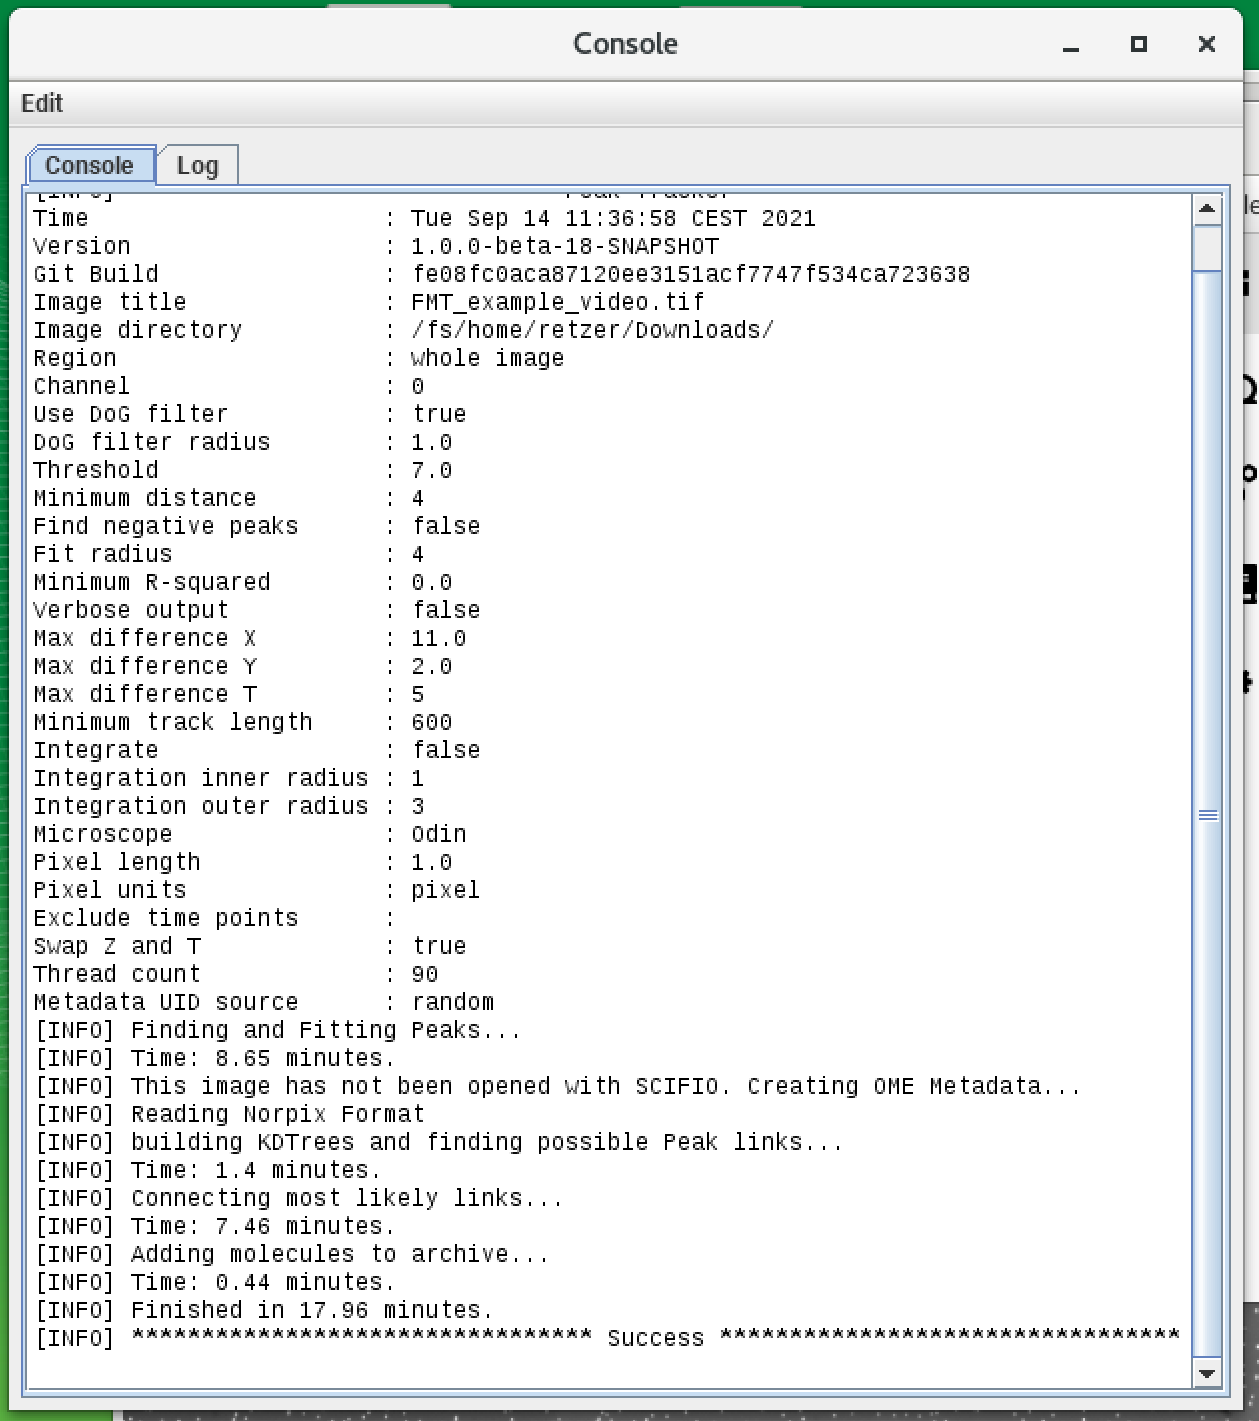
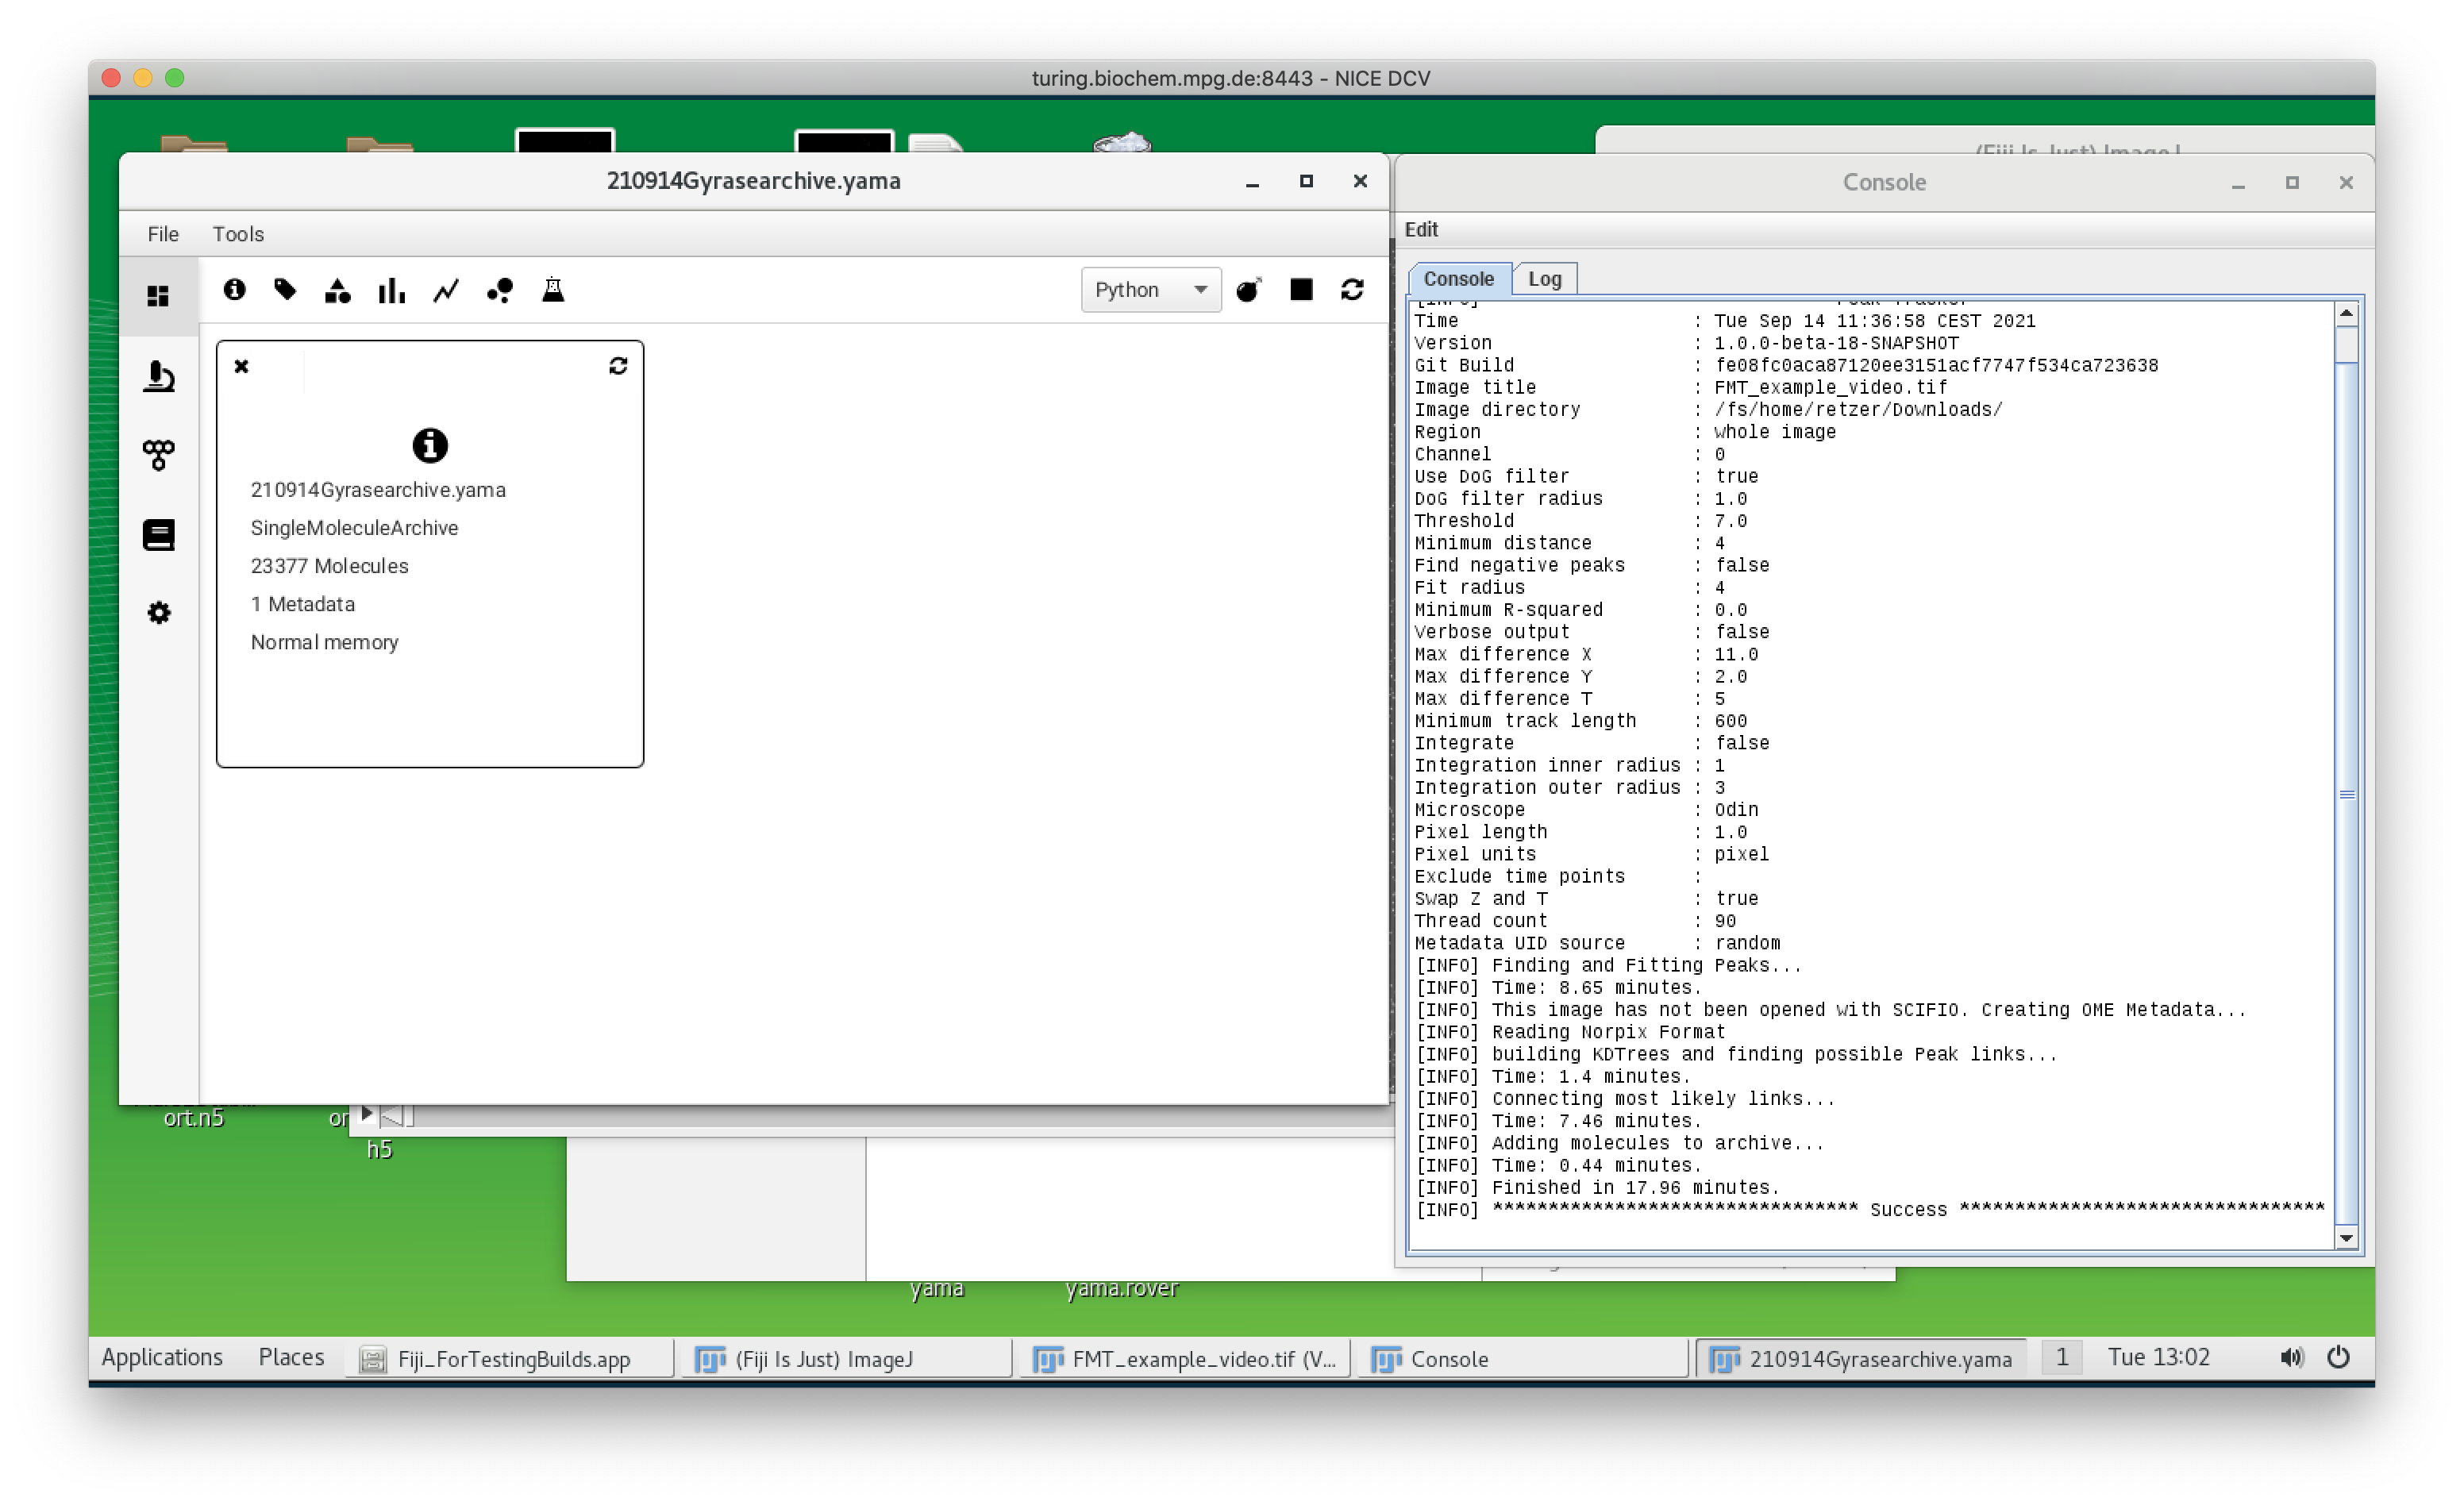
The Mars plugin comes with a built-in tracker. A simple example for using the tracker is explained in detail in the tutorial section and can be found here. The program uses ‘Difference of Gaussian filter’ (DoG filter) to find peak position with sub-pixel precision. Once peaks are found, the algorithm connects the peaks between frames making a trajectory of the bead movement in the xy-plane. In the screenshot below you can see the detection of single beads by the tracker (yellow crosses) and also the different parameters which can be set for the tracking which are stored in the archive (shown in the console). As mentioned before the provided video is quite big and needs a lot of computational power. Instead of tracking the original video, you can also use a truncated video file to test the tracking yourself which can be found here. It will result in lesser molecules but you can experience the tracking. The fully tracked archive is available here.
Mars GUI and archive
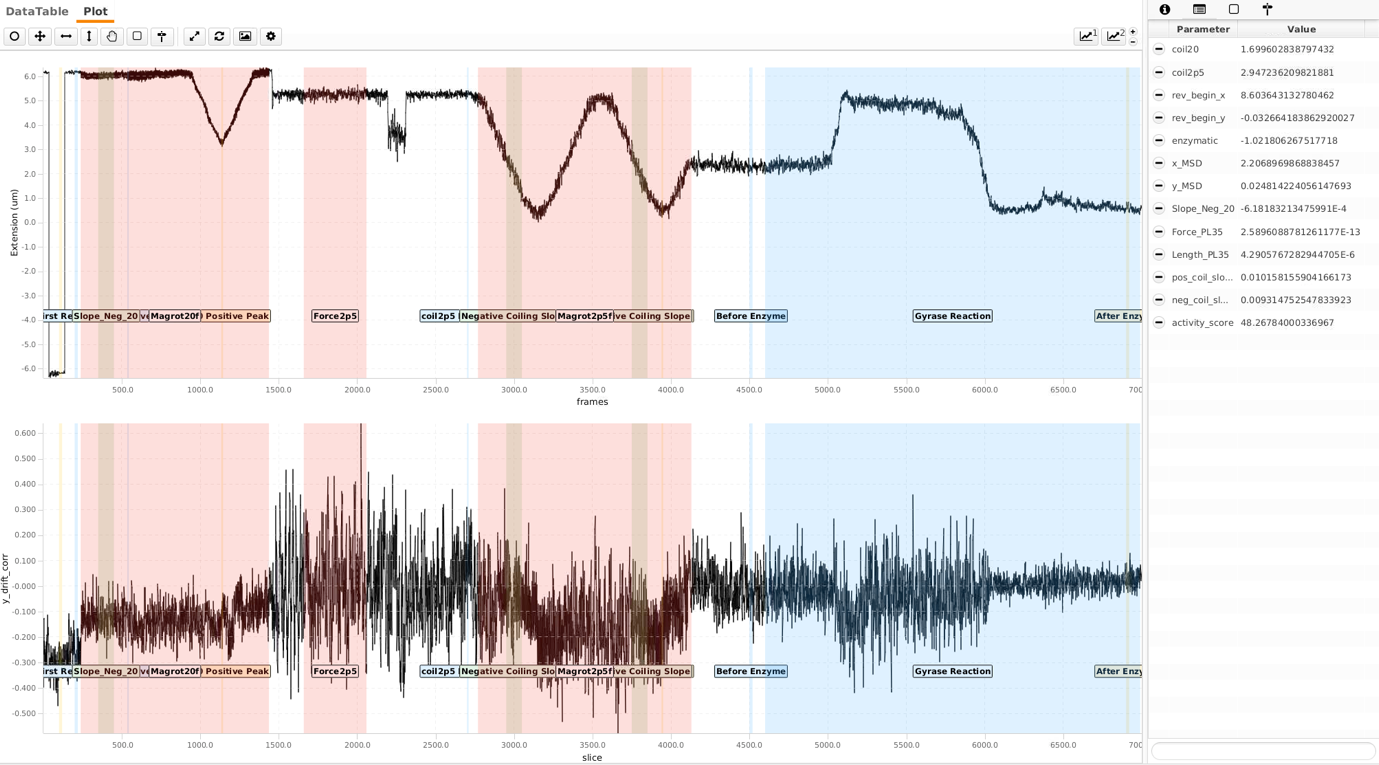
Once the tracking is done, an archive is created. The ‘Info’ widget shows how many molecules are tracked: in this case, there are 23377 tracked molecules (the number can vary depending on the tracking settings). All molecules here have unique IDs (UUID) for traceability and display the x and y tracking information by default. In the next step, these molecules are classified using tags.
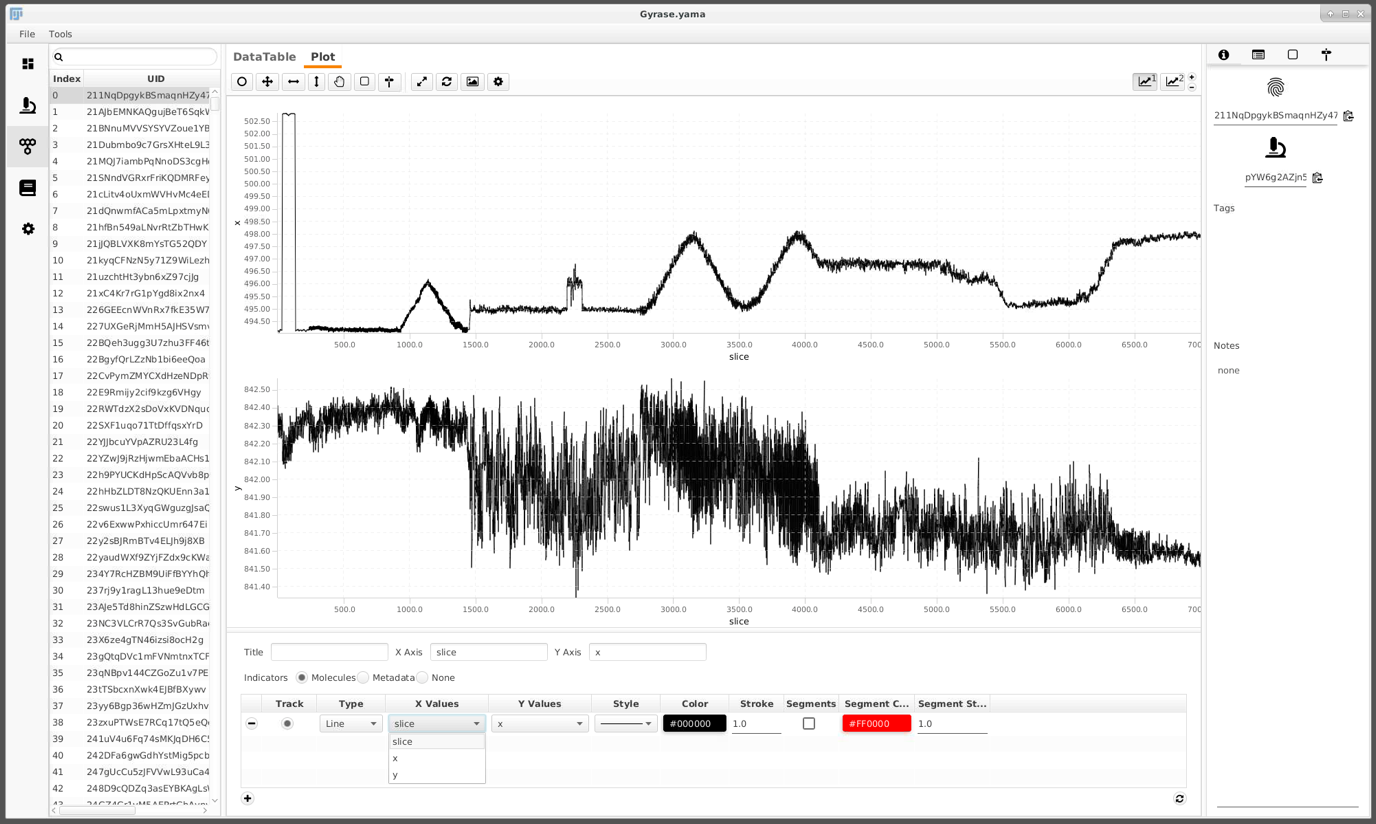
The screenshot below shows an example trace. The evolution of x and y over time is plotted. This trace shows the behavior which we are interested in.
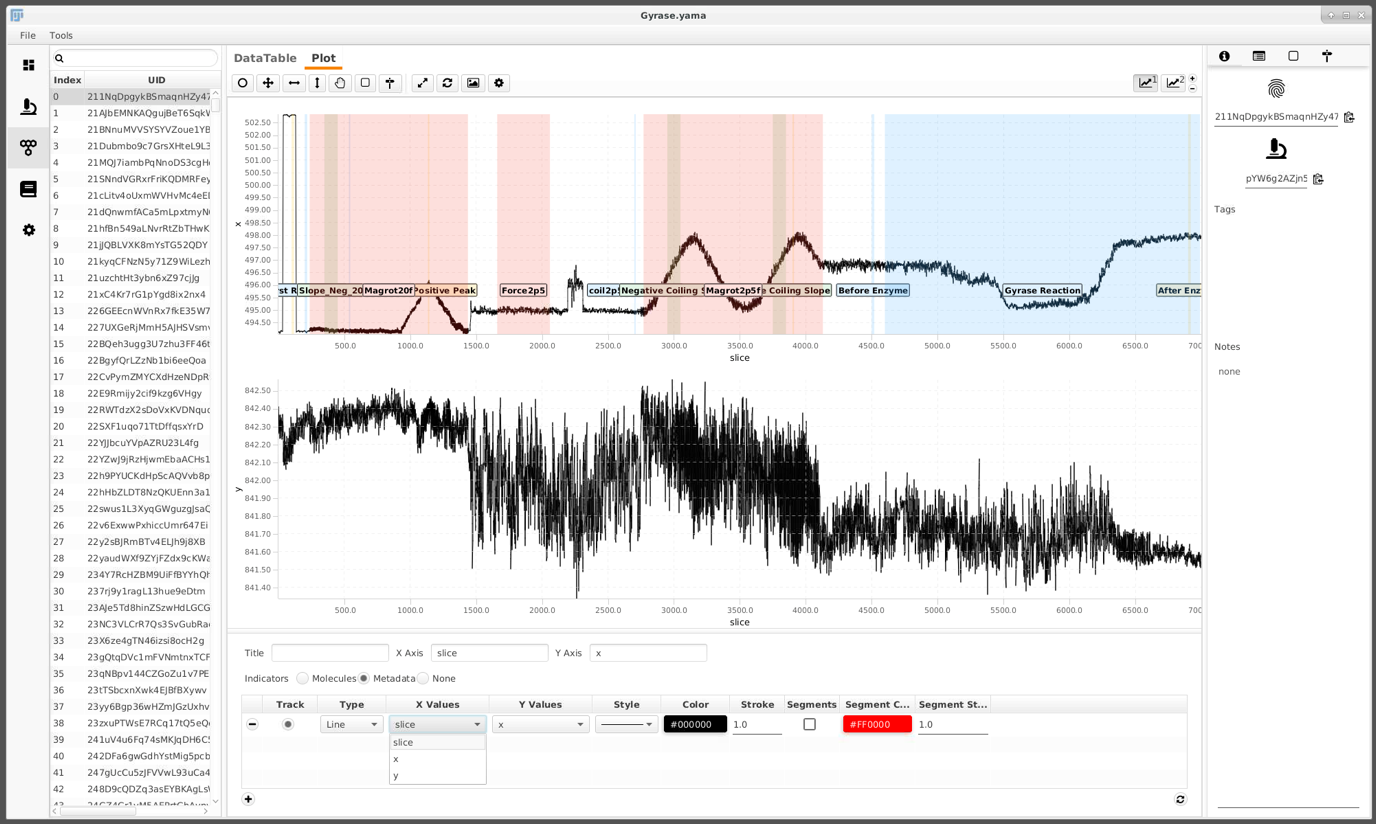
Add regions
Adding regions for different activities to the archive
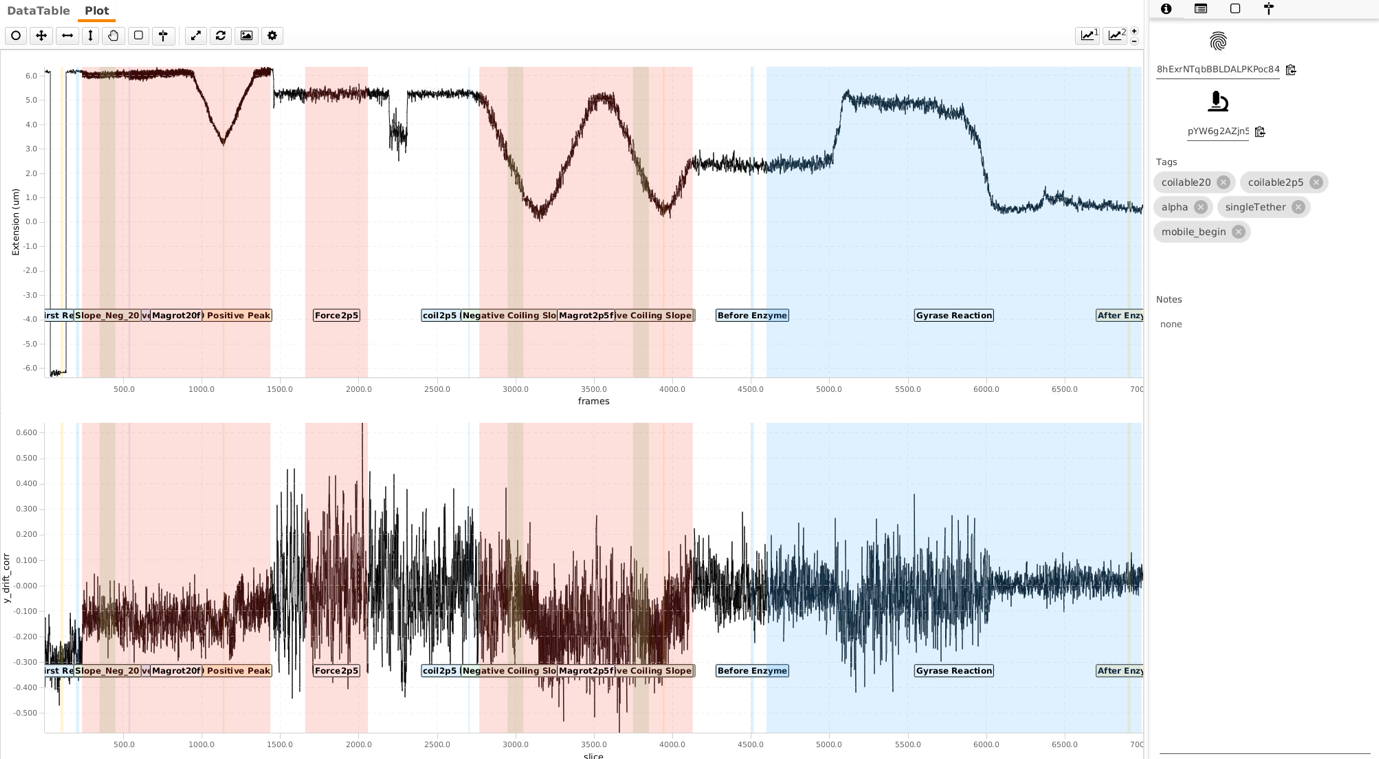
In the experiment conducted, different flow settings and magnet rotations were applied at certain time points to probe for certain DNA behaviors. These time points are annotated in the archive using ‘regions’. In this example a groovy script)assigns these automatically. It is the first one out of three groovy scripts used. If you are interested in groovy scripting you can check out our tutorials here.
Classification using groovy scripts
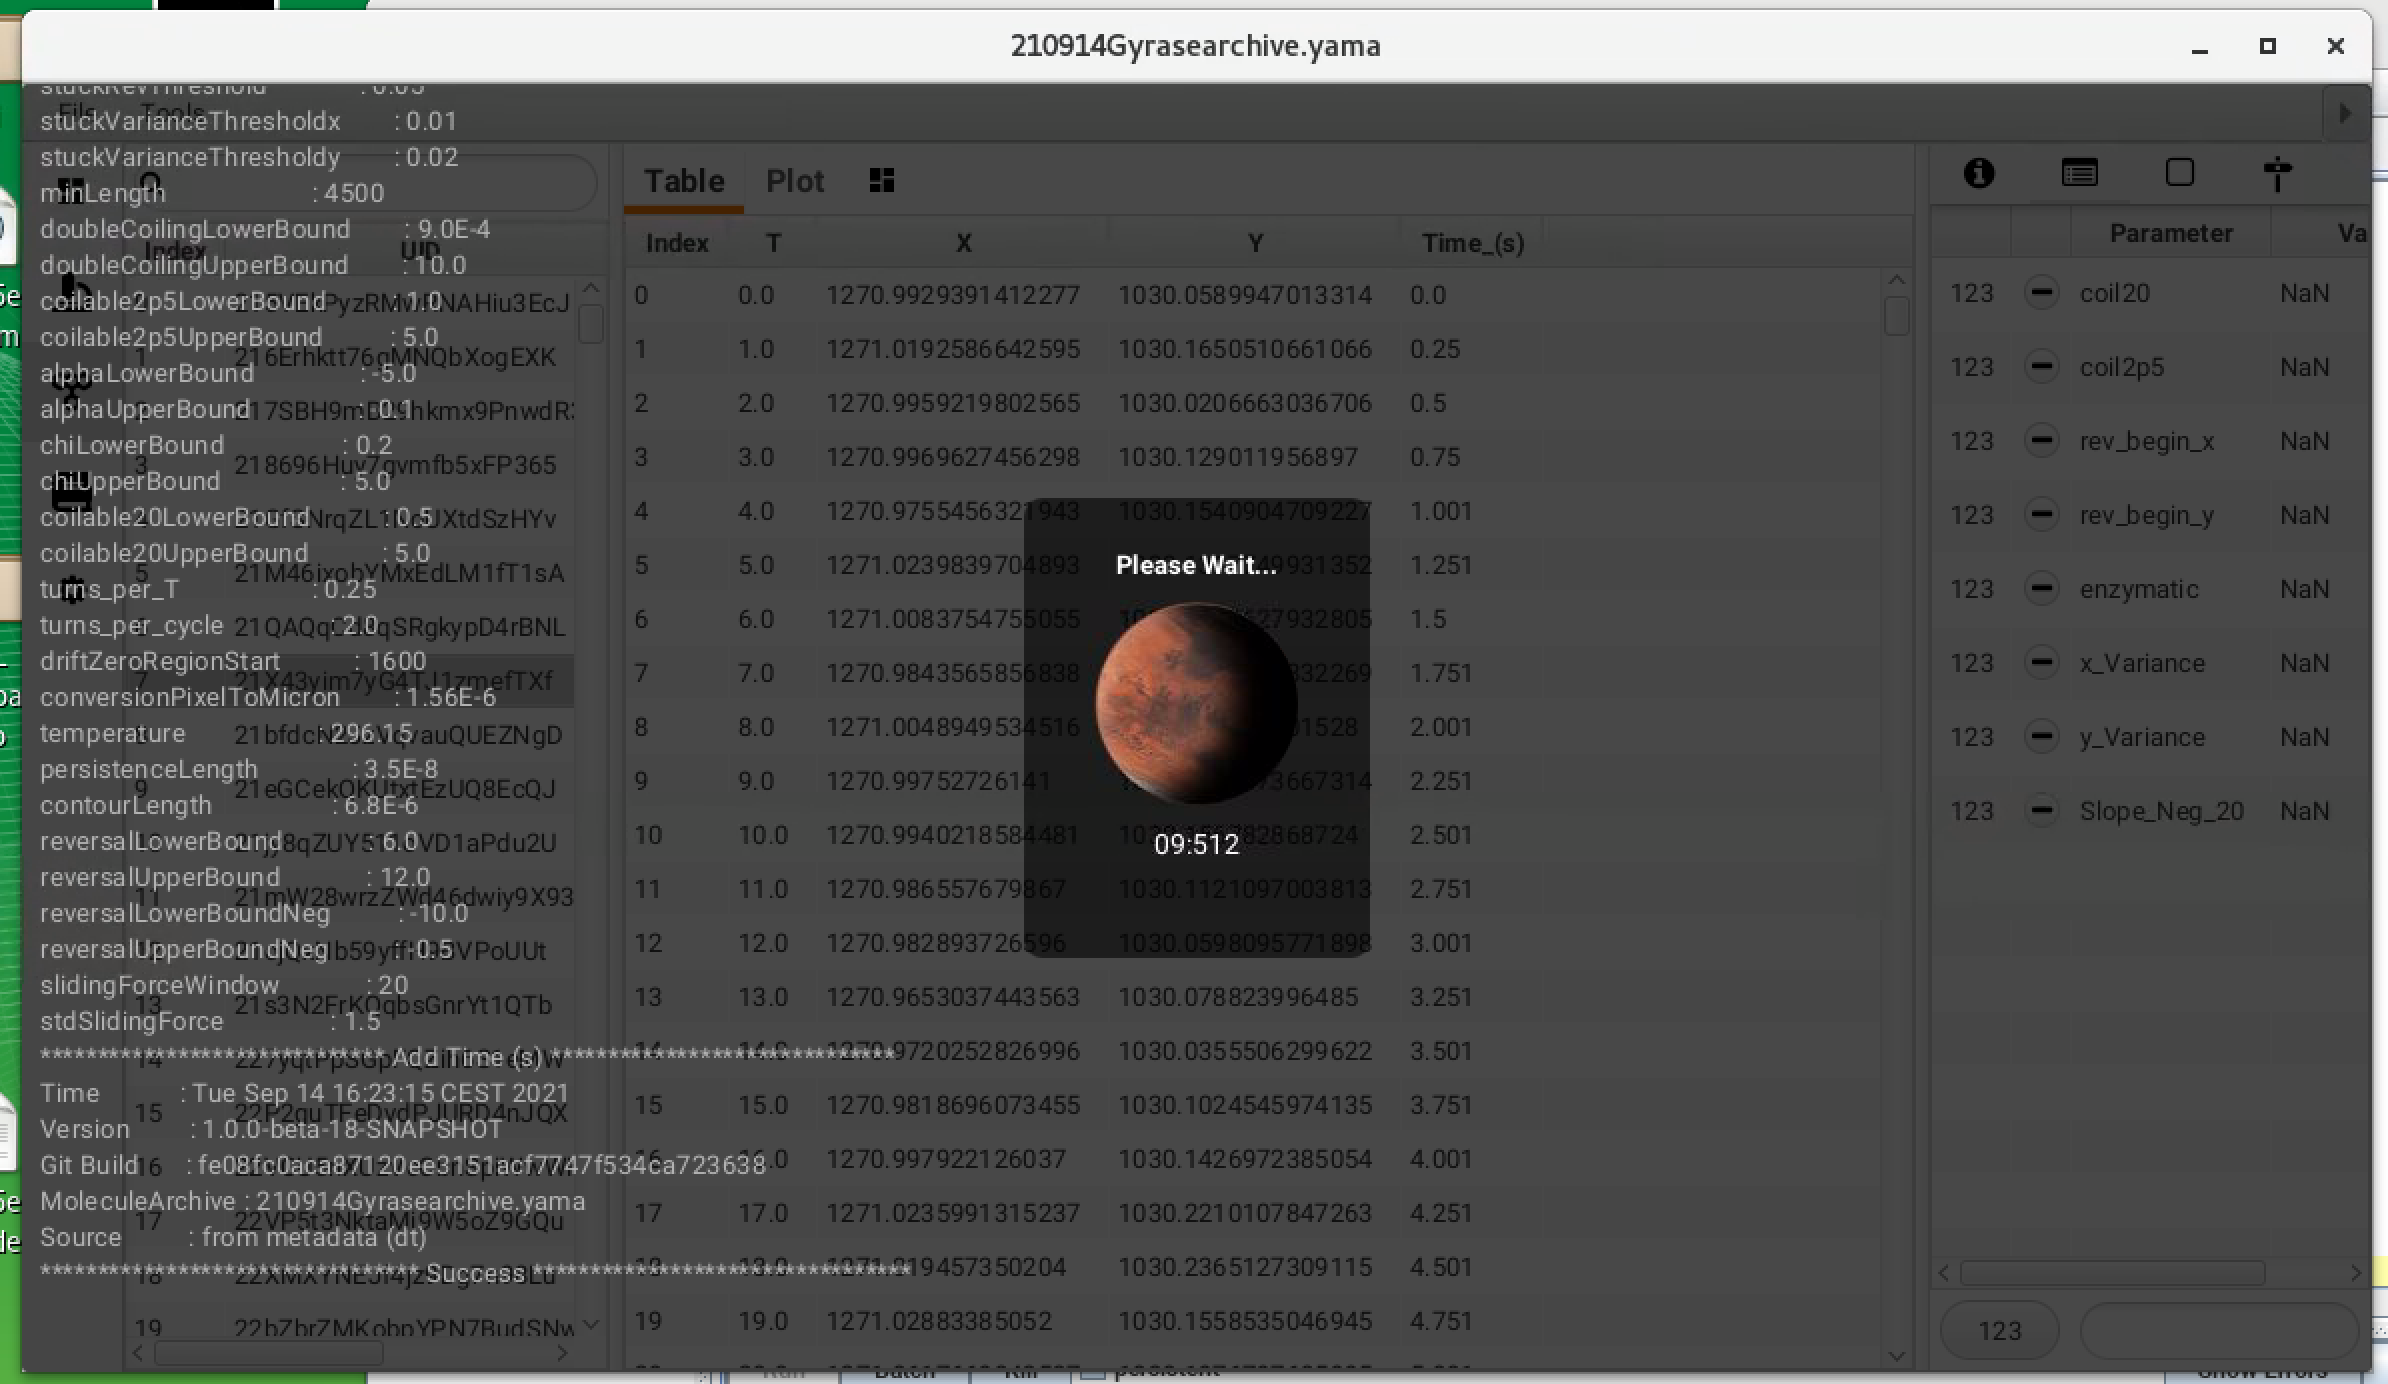
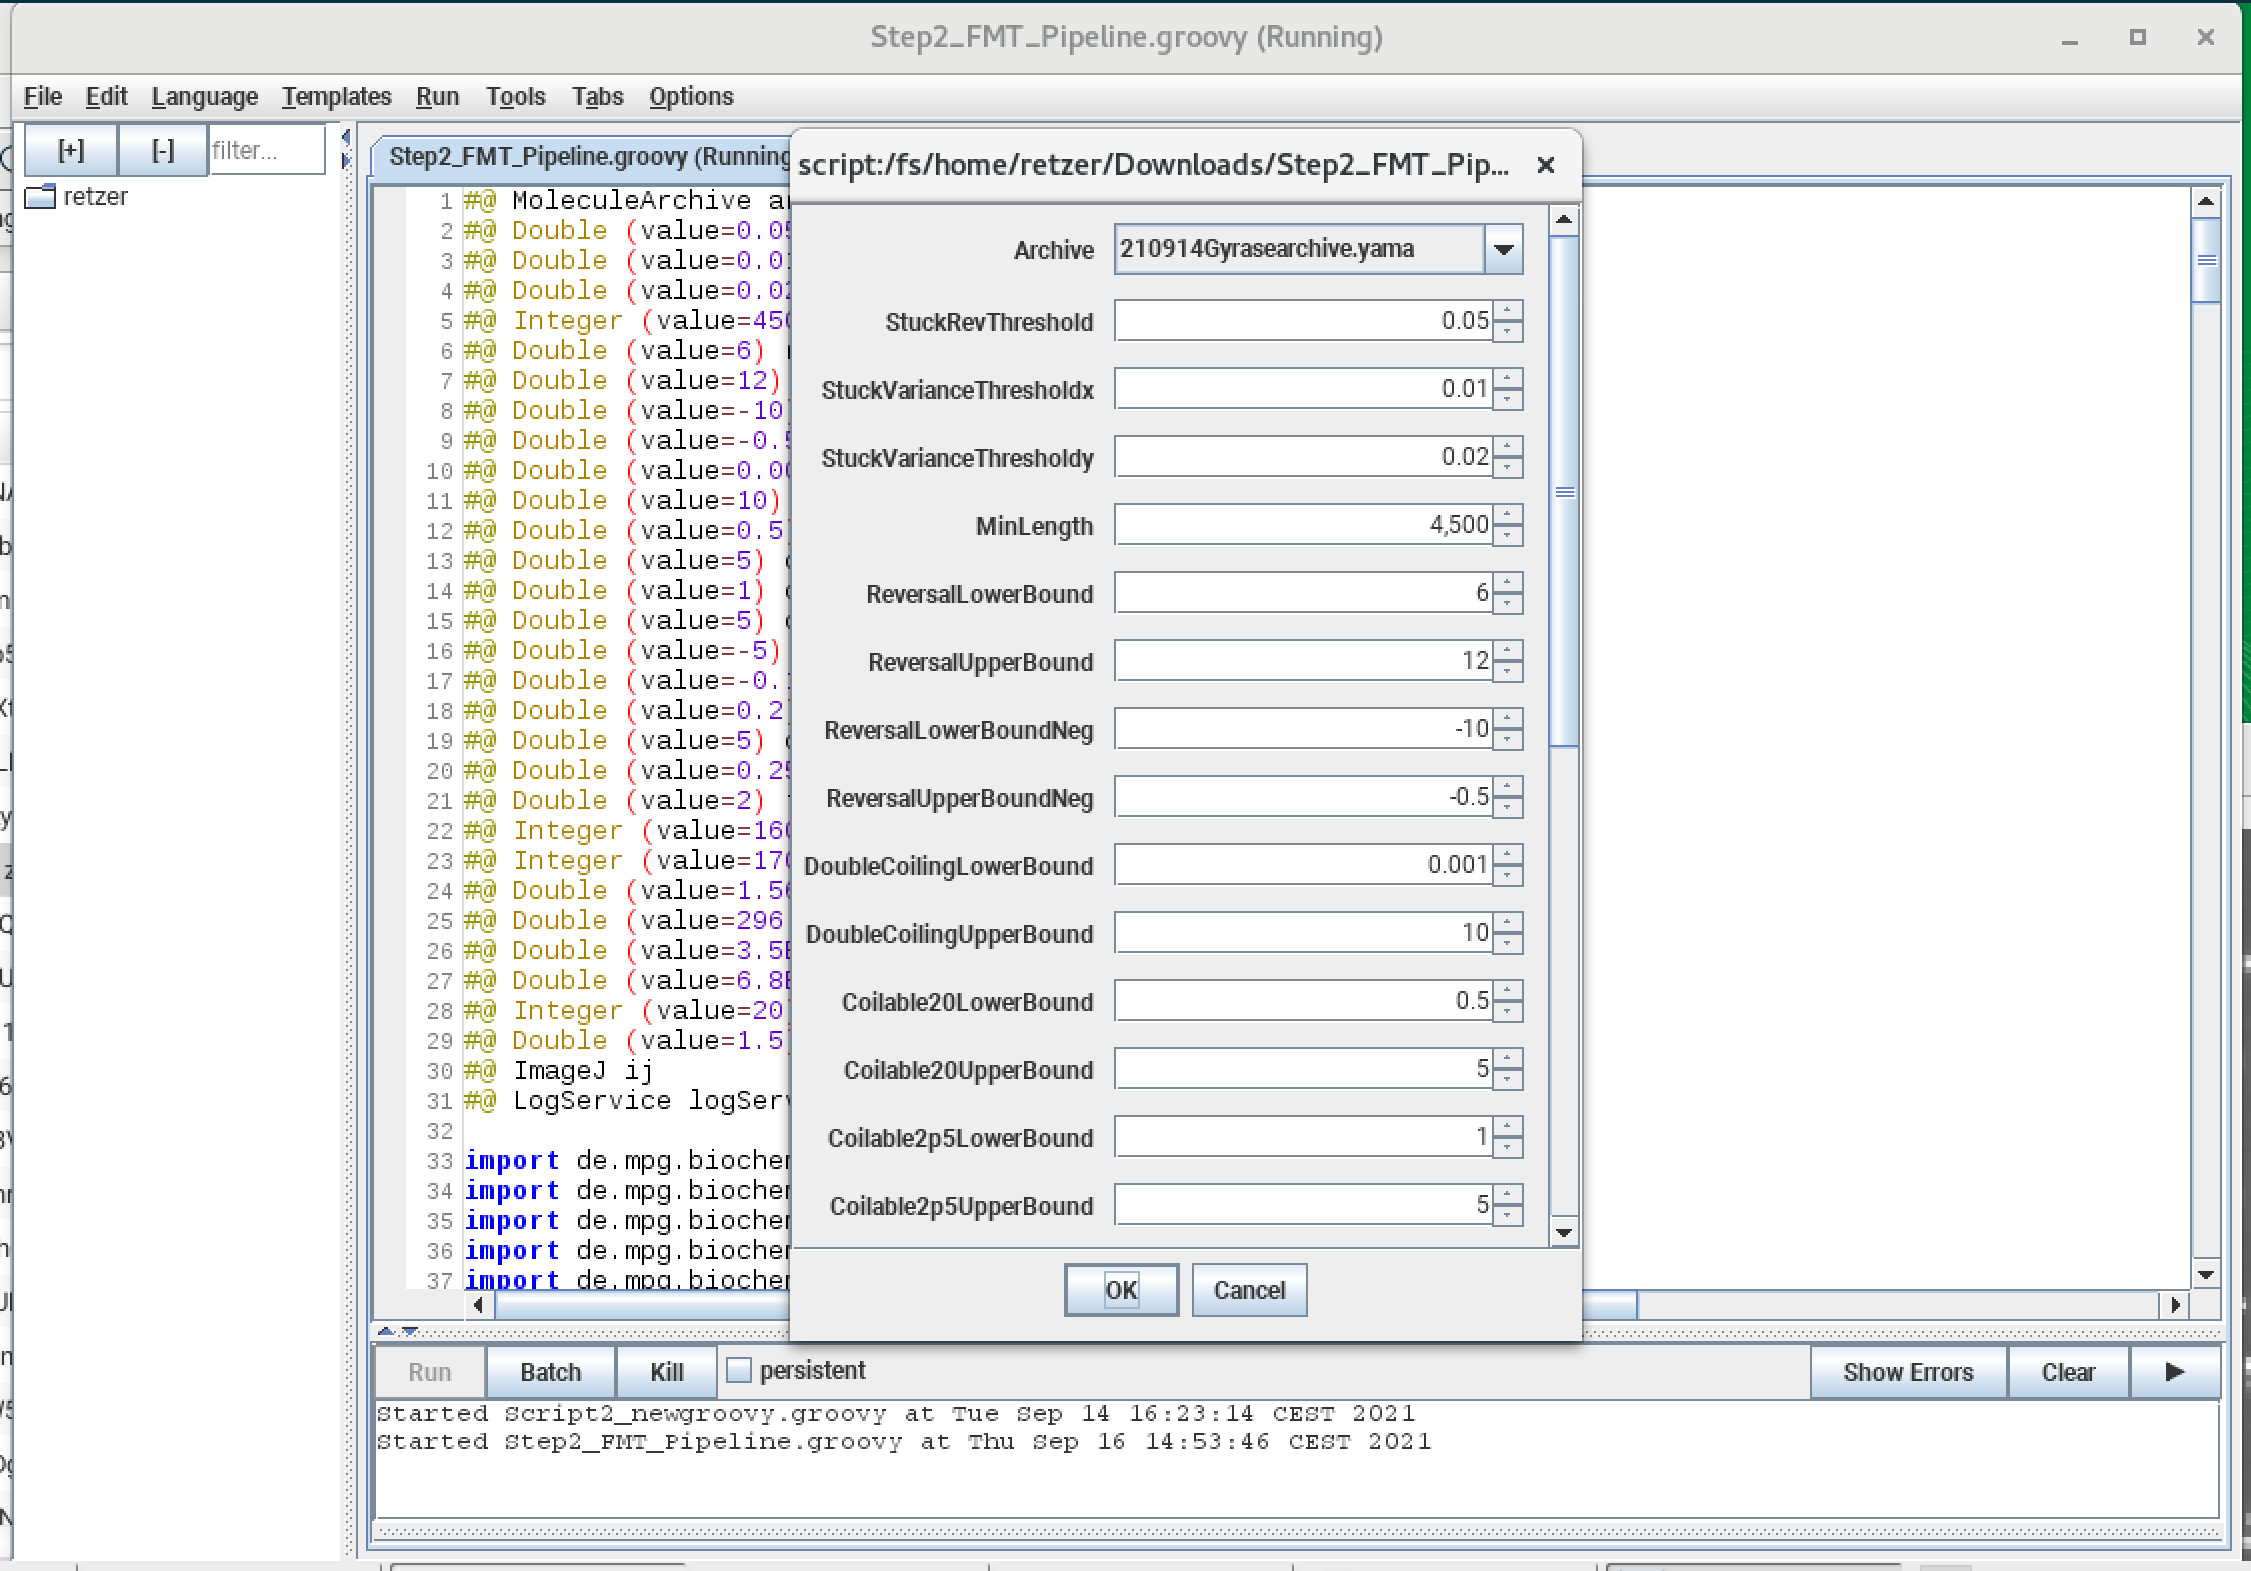
Selecting parameter boundaries and tags
To classify the identified molecules in the archive, parameters are calculated and compared to threshold values. In this case, a specific threshold value has been met a tag will be assigned to the molecule. By selecting a set of tags, molecules can be filtered easily without having to remove data from the dataset. More information on the parameters and the tagging strategy can be found here. Script 2 was applied on the MoleculeArchive to do these calculations for each molecule automatically. After running the script, these parameters and tags are stored in the archive.
Create and export the final data for Python
Final data
Now the data is analyzed and sorted with a final groovy script. The final data can be plotted using external programs like Python or Matlab. To do so a Groovy script is applied that generates a CSV file containing parameters from the filtered set of molecules. This script specifically looks for specific tags and then tries to find the maximum inclination in the positive and negative coiling steps. For that, a sliding window approach is utilized. Furthermore, the beads are corrected for drift using the stuck beads as a reference.
Plotting the dataset with Python
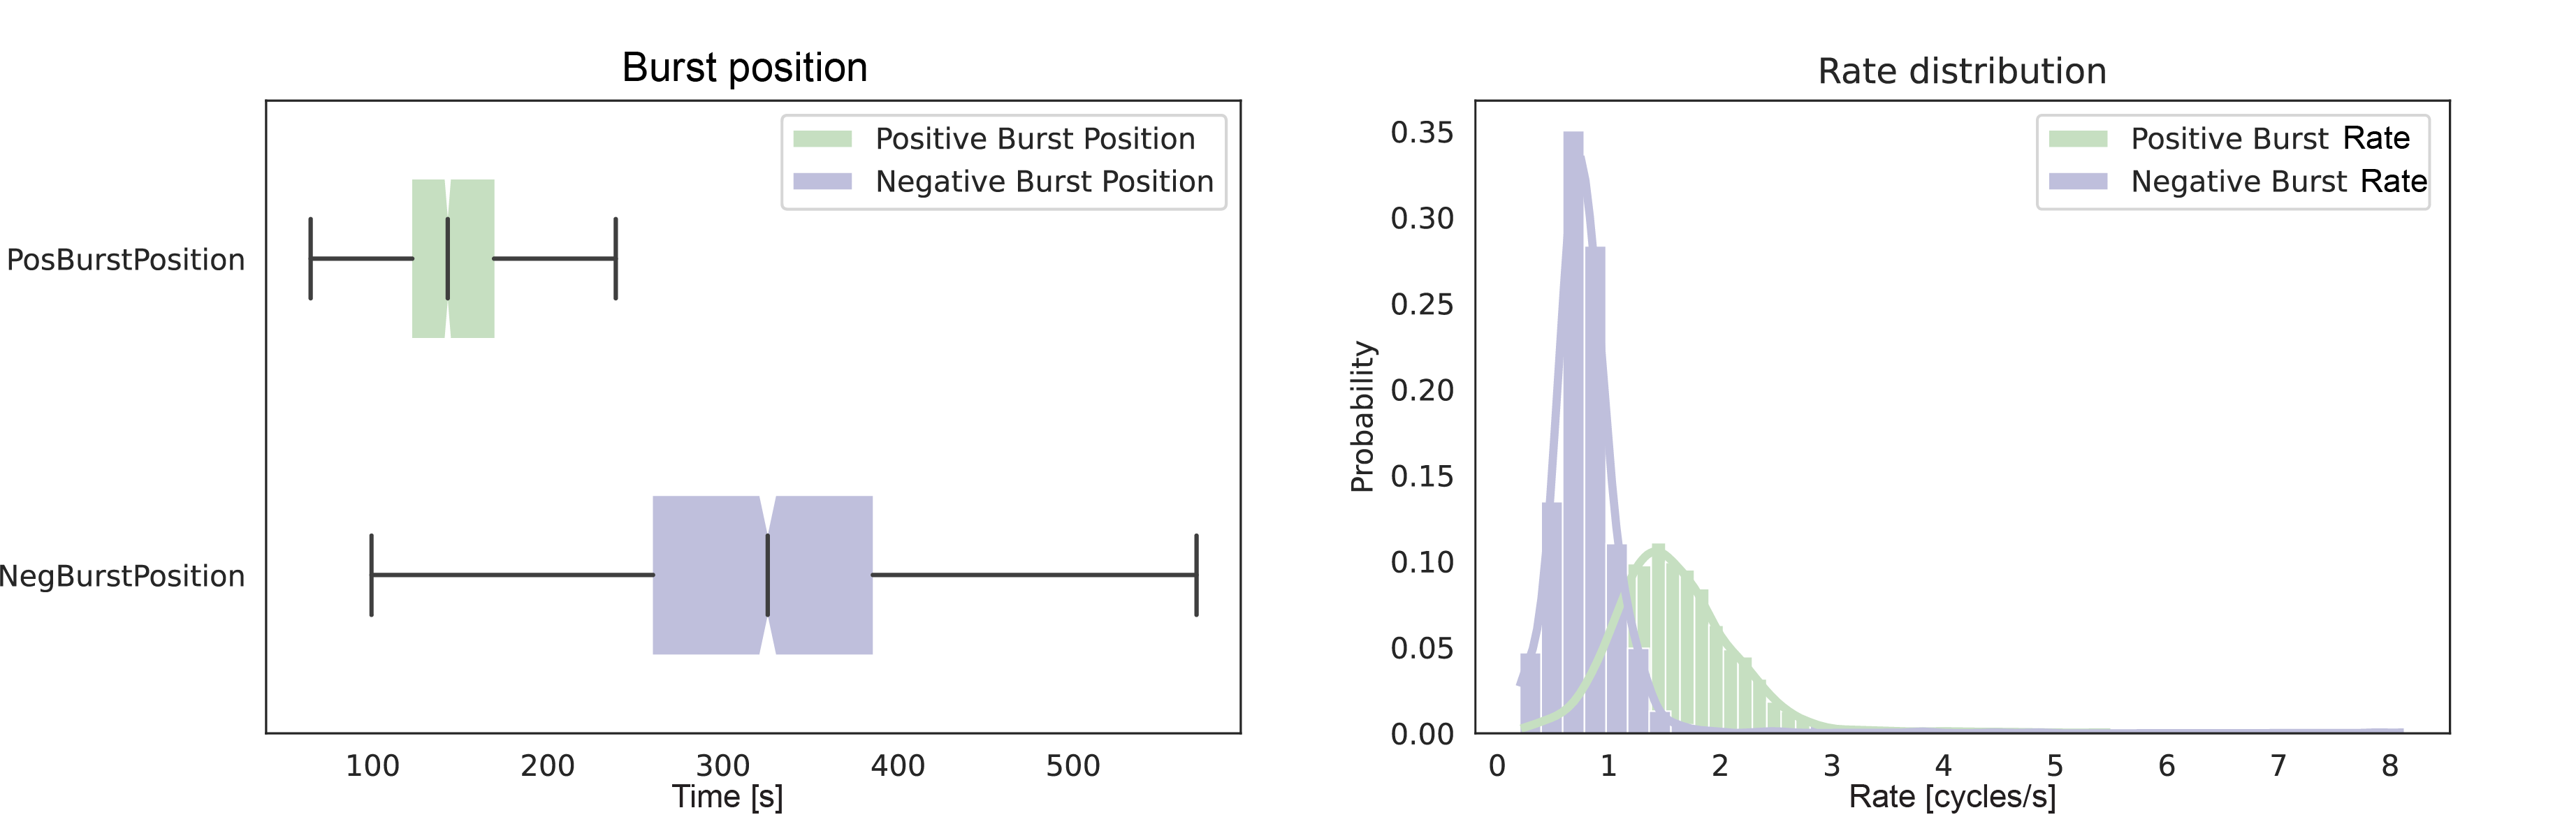
To investigate positive uncoiling and negative coiling rates a plot is made which shows these rates with respect to the time point of measurement. Data from the CSV file generated in the previous step is plotted using a Python script. The plot generated nicely illustrates the difference in velocity depending on positive or negative coils.
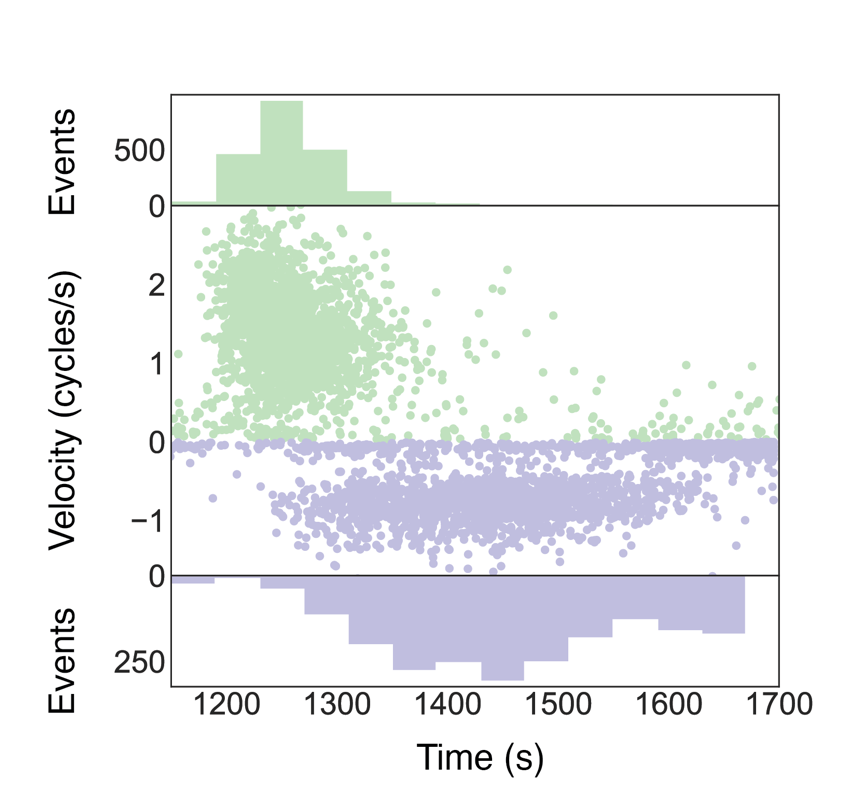
You can also plot the burst position as a boxplot to condense the information. Furthermore, the rate of positive relaxation and negative introduction can be plotted as a histogram. This nicely displays the difference in the rate because the distribution shifts over for the negative introduction. The jupyter notebook can be found here.
Conclusion
This example illustrates how to go from a huge data set to figures which can be used for a publication. Because Mars stores every information during the analysis process everyone can reproduce the steps. Furthermore, if one wants to revise the parameters or thresholds one can easily start over because no trace was deleted in the process.
If this example caught your attention please check out our more step-by-step ‘tutorials’ and try to use your own dataset afterward. If you encounter a bug please contact us on the forum.
References
1Agarwal, R.; Duderstadt, K.E. (2020), “Multiplex flow magnetic tweezers reveal rare enzymatic events with single molecule precision”, Nat Commun 11: 4714, https://doi.org/10.1038/s41467-020-18456-y
2 Nöllmann, M., Stone, M., Bryant, Z. et al. (2007), “Multiple modes of Escherichia coli DNA gyrase activity revealed by force and torque”, Nat Struct Mol Biol 14: 264–271, https://doi.org/10.1038/nsmb1213