Peak Tracker
This command is used to find, fit and track peaks in images. Typically these are polystyrene beads or single fluorescent dyes or groups of dyes attached to biomolecules. This command is nearly the same as the PeakFinder command but with the addition of tracking and fewer output options. So a lot of the input documentation is the same between the two commands.
This command outputs a Single Molecule Archive in which individual molecule records have Tables with the X, Y and T positions. If verbose is checked, then all fit parameters are added to the Table. The Molecule Archive will also contain metadata information from the image that can be used to convert from T to time and do a number of other useful operations provided by the other commands in the Molecule submenu.
The How to Find Tracked Molecules in the Video tutorial explains how to overlay tracking results on image. This allows for exploration of Molecule Archive records together with overlays on the original images. By running the movie forward frame by frame it is possible to see when tracking goes wrong and how to further optimise the tracking settings or if two tracks should be merged.
The PeakTracker is well suited for common tracking requirements in single molecule experiments. If you find that the available options and image views do not fully meet your needs give TrackMate a try. TrackMate offers a wider range of peak finding and tracking options and track merging tools. After performing tracking with TrackMate export your results to Mars by follow the How to convert TrackMate Results to Mars tutorial.
Note - Currently the status bar only runs during the peak finding and fitting steps. But tracking can also take some time. So be patient and your archive will appear. You can always check the console to see if a problem has occurred under Window->Console. Here you will also find the time it took for each step of the process and all the settings. The setting will also be placed in the log of the metadata record created and placed into the Molecule Archive created.
Input
- Image - The active image selected will be used by the PeakTracker. The name of the image that will be processed shows up at the top Input tab of the dialog.
- Region - Select the region of the image for processing. This could be the entire image, the active ROI displayed on the image, or all ROIs from the ROI Manager. Simple selection are easily made with the box tool that add rectangular ROIs to the image. However, arbitrary ROI selections are also supported. To process multiple ROIs at the same time, add them all to the ROI manager. Instructions on ROI tools can be found in this video.
- Channel - Select which channel to analyze in case a video with multiple channels is provided as input. Mars uses a zero-based index in contrast to the default 1-based indexing in Fiji. For example, if you want to process channel 2 as displayed in the ImagePlus in Fiji, select channel 1 in the PeakTracker dialog.
Find
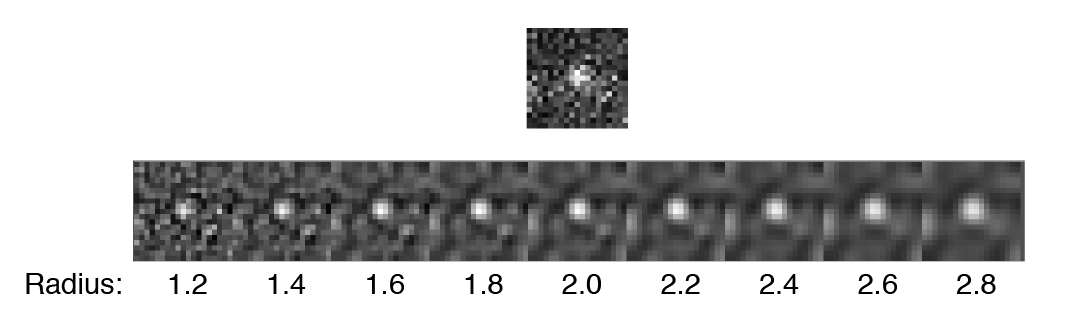
- DoG filter - If checked the image will be processed with a Difference of Gaussian (DoG) filter before peak finding. Using an appropriately chosen radius this filter enhances real peaks with signal spread among several pixels and suppresses salt and pepper noise as demonstrated in this systematic study. If unchecked the raw image will be used for peak finding.
- DoG radius - The radius used for DoG filtering. The value chosen should reflect the size of the desired peaks. Decimal numbers are permitted.
- Threshold - This is threshold in pixel value used for peak detection. Pixels with values above this threshold are considered peaks and pixels below this threshold are considered background. For everyday peak detection, the DoG filter should be used in which case this threshold using on the DoG filtered image. In this case, we have found that values between 40 and 60 provide optimal detection for typical single-molecule observations. If the DoG Filter is turned off this threshold reflects raw pixel values in the input image.
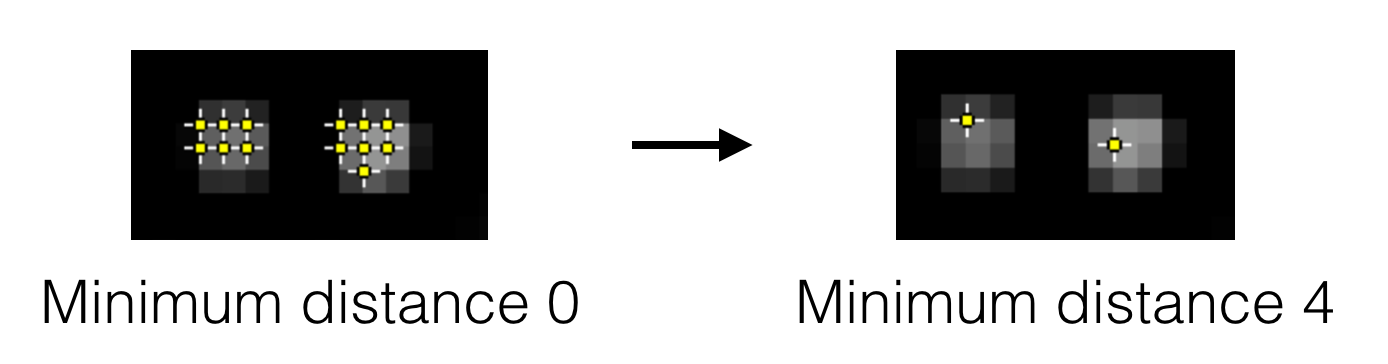
- Peak separation - This is the minimum allowed distance between peaks. This means only the pixel with the highest intensity within this radius will be accepted as a peak, even if there are other pixels above the threshold within this radius region. This is an important setting since most peaks have nearby pixels that are also above the detection threshold, but we only want to detect each peak once. See the image below for an example.
- Find Negative Peaks - If checked peak with negative pixel values are detected. This can be used in gradient images, where a negative gradient results in a negative peak. This is useful for detecting the edges of long DNA molecules and other structures.
Fit
- Radius - The radius of pixels used for peak fitting. 0 is one pixel, 1 is 9 pixels, 2 is 25 pixels. Usually 3 or 4 is a good estimate depending for typical single-molecule observations. Optimal fitting is done using a region with background pixels at the edges.
- R-squared - Caution: This should remain set to 0.0 unless there is a very good reason to filter poor fits. Normal single-molecule data has a broad range of R-squared values. This input is the minimum allowed value of R-squared resulting from peak fitting. R-squared is defined as 1 - SSres / SStot to match the definition used in Prism as defined here with 1.0 for perfect fits and 0.0 for fits no better than a straight line. Typical single-molecule images are noisy leading to large variation in R-squared values so this threshold should only be used as an additional step if further peak rejection is required.
Track
The following are settings for tracking absent in the PeakFinder command. Once all peaks have been found and fit, which peaks correspond to which molecules between slices is still unknown. To connect all the peaks, the PeakTracker does a nearest-neighbor search between frames. The closest peak in the next frame to the current peak position is considered the same molecule.
- Max ΔX - The threshold difference between the X position of two peaks below which they are still allowed to be linked.
- Max ΔY - The threshold difference between the Y position of two peaks below which they are still allowed to be linked.
- Max ΔT - The number of timepoints (T) into the future to search for a possible link. This parameter is very important to ensure tracking is robust against single frames where peaks are not detected. Blinking events could cause a molecule to go dark for a couple frames. This setting ensures the track is still linked once the molecule is bright again. Alternatively, a molecule could go out of focus, again causing it to go below the detection threshold. If this value is too large, it will take a long time to track and bad links will start to be formed. Usually 3 to 5 is a good range.
- Minimum length - All tracks with fewer than this number of slices will be rejected and removed from the Molecule Archive. Frequently single-molecule experiments have many short tracks resulting from molecules appearing for only a couple frames then going away. This removes all these events.
Integrate
- Integrate - Integrate the peak intensities and add them in an intensity column. Adds up the total intensity of the inner region with the median background subtracted from each pixel. The median background is calculated from the background region. If you want are integrating molecules at fixed positions throughout an experiment, consider using the MoleculeIntegrator command instead of the PeakTracker.
- Inner radius - The radius of the region to integrate around the center of the peak. 0 is one pixel, 1 is 9 pixels, 2 is 25 pixels. Typically 1 is a good value but this depends on the size of molecules on the camera sensor.
- Outer radius - The radius of the region to use for calculating the local median background. This is subtracted from the inner region. Typically 3 is a good value. This radius should be ~2 pixels larger than the inner radius.
Output
- Microscope - The name of the microscope used for data collection. This name is included in the metadata record.
- Pixel length - Length of a pixel in the microscope system used for data collection.
- Pixel units - Units of the provided pixel length. WARNING: Units other than pixel are currently not fully supported by many Mars commands and rover options.
- Exclude - List timepoints to exclude from the tracking process. This allows the user to exclude frames from the analysis without having to delete them from the dataset irreversibly and ensures the metadata from the original data collection remains intact. A comma separated list of single timepoints or ranges of timepoints (e.g. 10, 300-500, 700-900) should be provided.
- Verbose - If checked all fit parameters are included in the output (baseline, height, x, y, sigma, R2). If unchecked only the position, slice, intensity columns will be included in the output. Verbose output can be used to optimise the R-squared minimum, or for calculations based on peak properties.
- Metadata UID - Determines whether the metadata UID is unique from the dataset or generated randomly. If unique from dataset is selected Mars will attempt to generate the UID from an existing UUID contained in the metadata or unique information from the metadata, if this fails a random UID will be used.
- Threads - Determines how much computing power of your computer will be devoted to this calculation. A higher thread count decreases computing time.
Preview
- Preview - When checked all detected peaks are highlighted based on the current setting. This is very useful for finding the correct settings that detect just enough peaks without too much background. This will live update as parameters are changed, such as the detection threshold. This is used before running the command to confirm you have the correct settings.
- Roi - This sets the type of roi displayed in preview mode, either circle or point. If circle is chosen the radius of the circle will be the Fit Radius described below. In the case of a circle, the inner radius specified in the Integrate tab determines the size.
- count: - Number of peaks detected in the current image.
- T - Scrollbar to select the timepoint (T) to preview with live update using a zero-based index.
- Timeout(s) - Maximum computing time allowed to calculate the preview of the settings. If the video is too large or the settings are way off the computing time could become rather significant causing a crash of the system. Setting this limit prevents that.
Result
- Molecule Archive - A Single Molecule Archive with individual records for all tracked molecules as well as metadata information. If the command finishes and no Molecule Archives opens, check the console for an explanation (Window->Console). No Molecule Archive will open if no molecules meet all finding, fitting, and tracking criteria. This will be reported in the console.
How to run this command from a groovy script
#@ Dataset dataset
#@ ImageJ ij
#@OUTPUT MoleculeArchive archive

import de.mpg.biochem.mars.molecule.*
import de.mpg.biochem.mars.image.commands.*

//Make an instance of the Command you want to run...
PeakTrackerCommand peakTracker = new PeakTrackerCommand()

//Populates @Parameters Services etc. using the current context
//which we get from the ImageJ input.
peakTracker.setContext(ij.getContext())

peakTracker.setDataset(dataset)
//Options: "whole image" or "ROI from image" or "ROIs from manager"
peakTracker.setRegion("whole image")
peakTracker.setChannel(0)
peakTracker.setUseDogFiler(true)
peakTracker.setDogFilterRadius(1.8d)
peakTracker.setThreshold(50)
peakTracker.setMinimumDistance(5)
peakTracker.setFindNegativePeaks(false)
peakTracker.setFitRadius(3)
peakTracker.setMinimumRsquared(0)
peakTracker.setMaxDifferenceX(5)
peakTracker.setMaxDifferenceY(5)
peakTracker.setMaxDifferenceT(5)
peakTracker.setMinimumTrackLength(10)
peakTracker.setIntegrate(true)
peakTracker.setIntegrationInnerRadius(2)
peakTracker.setIntegrationOuterRadius(4)
peakTracker.setMicroscope("Microscope")
peakTracker.setPixelLength(1)
peakTracker.setPixelUnits("pixel")
peakTracker.setExcludedTimePointsList("10, 20-21")
//Options: "unique from dataset" or "random"
peakTracker.setMetadataUIDSource("random")
peakTracker.setVerboseOutput(false)
peakTracker.setThreads(8)

//Run the Command
peakTracker.run()

//Retrieve output from the command
archive = peakTracker.getArchive()

//If run in Fiji the archive will appear,
//but you can continue to use it for further processing
//Using the retrieval command above.