Molecule Integrator (multiview)
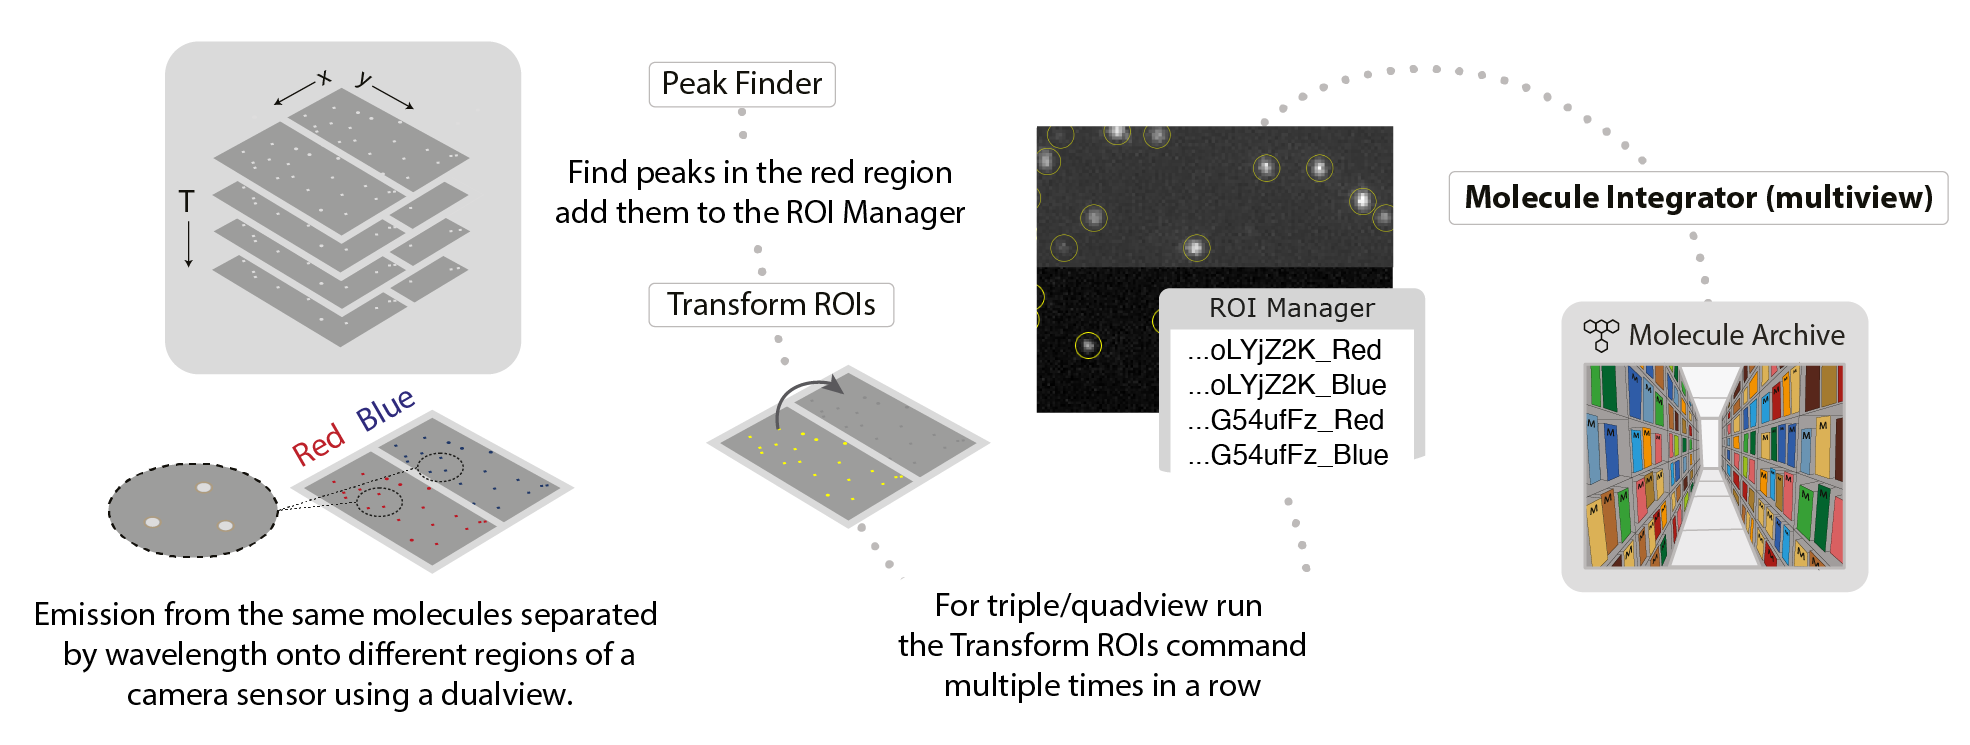
This command integrates the intensity of fluorescent peaks in images collected with dual or multiview setups in which different emission wavelengths are separated onto different regions of a camera sensor. A list of point or circle ROIs must be provided in the ROI Manager as setup prior to running this command. The same peak in different regions of the multiview should have the same UID but with the addition of a suffix with the subregion name. This could be the color or the name of the labeled component (i.e. UID_Red, UID_Blue or UID_DNA, UID_protein). The ROIs are generated using the PeakFinder and Transform ROIs commands. This command assumes the molecule positions marked with ROIs remain constant for all time points. Therefore, only one entry is required for each molecule for each region in the ROI manager without the need to specify a time point. The single ROI entry is then integrated for all time points (T).
The integrated intensity of peaks will be corrected for local background. The integration and background regions are specified using inner and outer radii. The final output is a Molecule Archive containing single molecule records with the fluorescence intensity for each wavelength as a function of time point (T). This command can be used to analyze experiments where two or more lasers are turned on to image different components simultaneously, or FRET experiments with only a single laser on at a given time. The FRET example provide a step-by-step guide using this command with sample data available.
If you would like to integrate the fluorescence of molecules that are moving, you can use the PeakTracker. However, fluorescence will only be integrated for time points where peaks were detected, so no background will be integrated after bleaching. Complete customization is possible in script by specifying integration maps with different positions for each time point for a given molecule.
Input
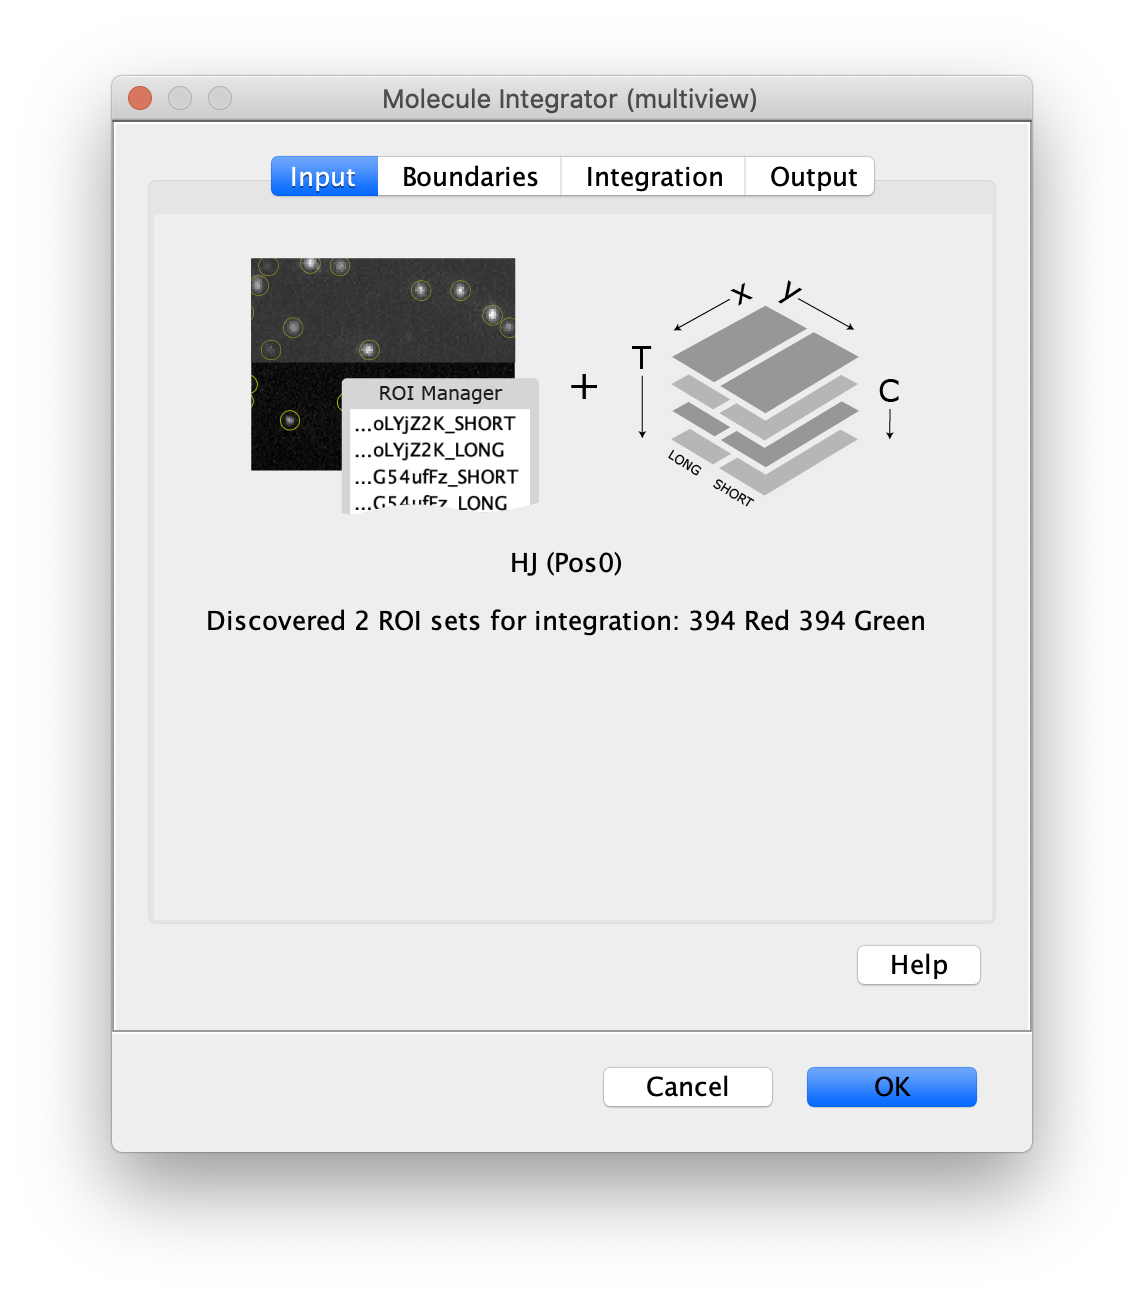
- Image - The active image is analyzed with the peaks in the ROI Manager. The name of the image will be displayed in the dialog.
- ROI Manager - A list of point or circle ROIs with unique names and suffixes for subregions in the ROI Manager that should be integrated.
Boundaries
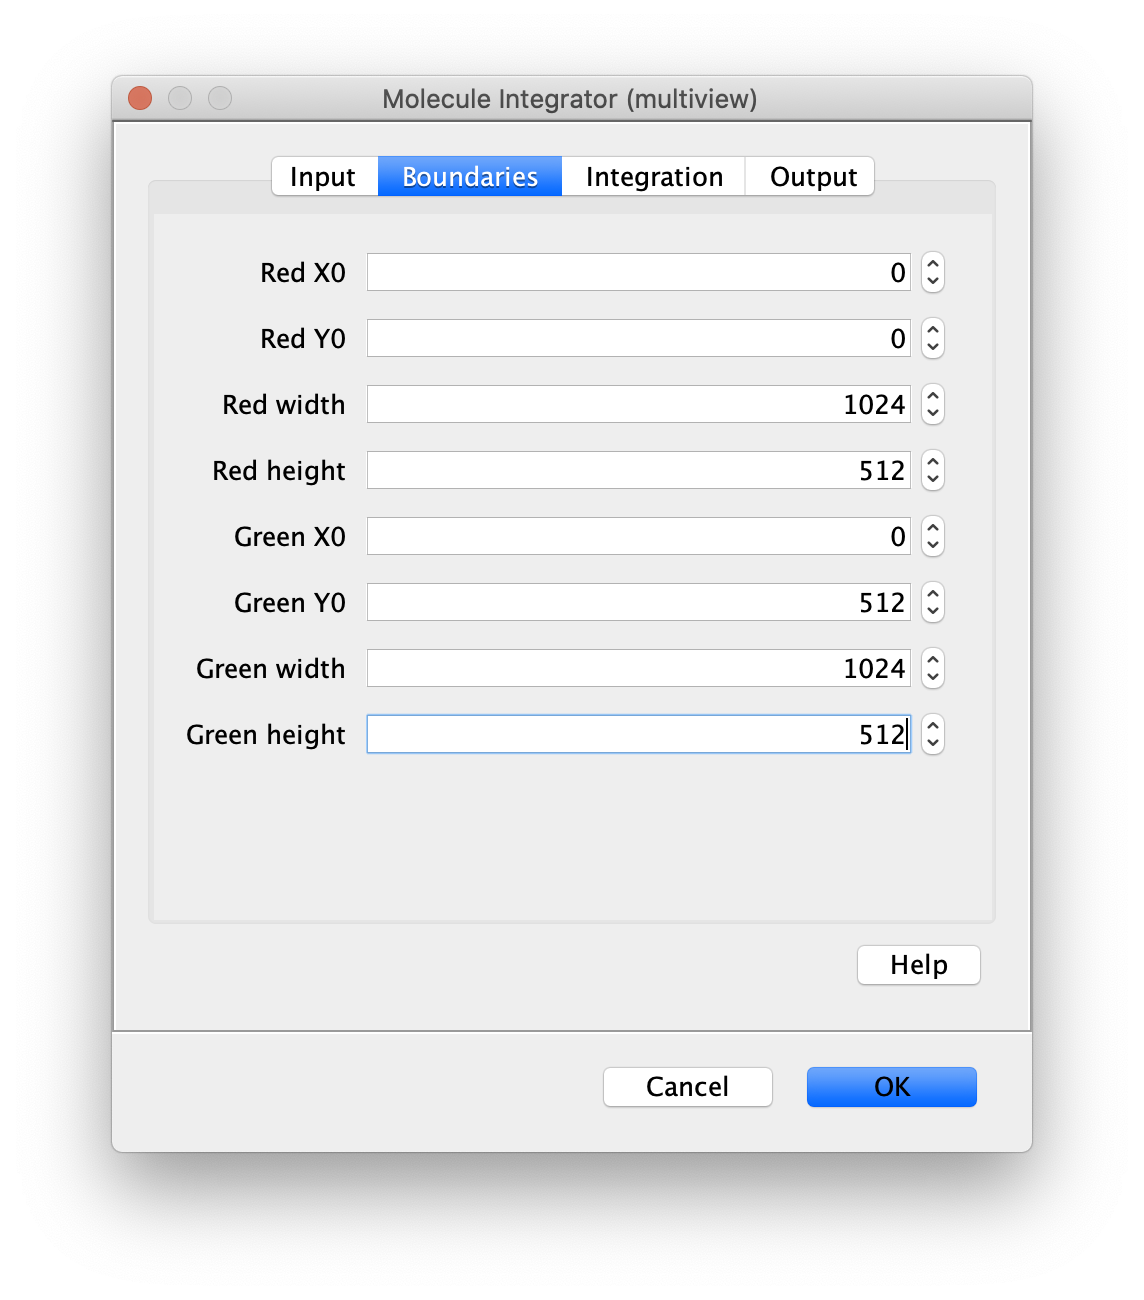
- [Region1] x0 - Upper left corner x0 position of region1.
- [Region1] y0 - Upper right corner y0 position of region1.
- [Region1] width - width of region1.
- [Region1] height - height of region1.
- [Region2] x0 - Upper left corner x0 position of region2.
- [Region2] y0 - Upper right corner y0 position of region2.
- [Region2] width - width of region2.
- [Region2] height - height of region2.
- [Region3] …
Each unique suffix found in ROI names in the ROI Manager specifies a region of the camera sensor. To ensure the intenisty and background integration radii do not include pixels from adjacent regions, the boundaries of all regions must be defined. When integration radii include pixels beyond the specified boundaries, the region will be mirrored to reduce edge artifacts due to large differences between the background levels in adjacent regions.
For example, the dialog settings displayed are for a camera sensor with dimensions 1024 by 1024 where the Red region is on the top half and the Green region is on the bottom half of the sensor.
Integration
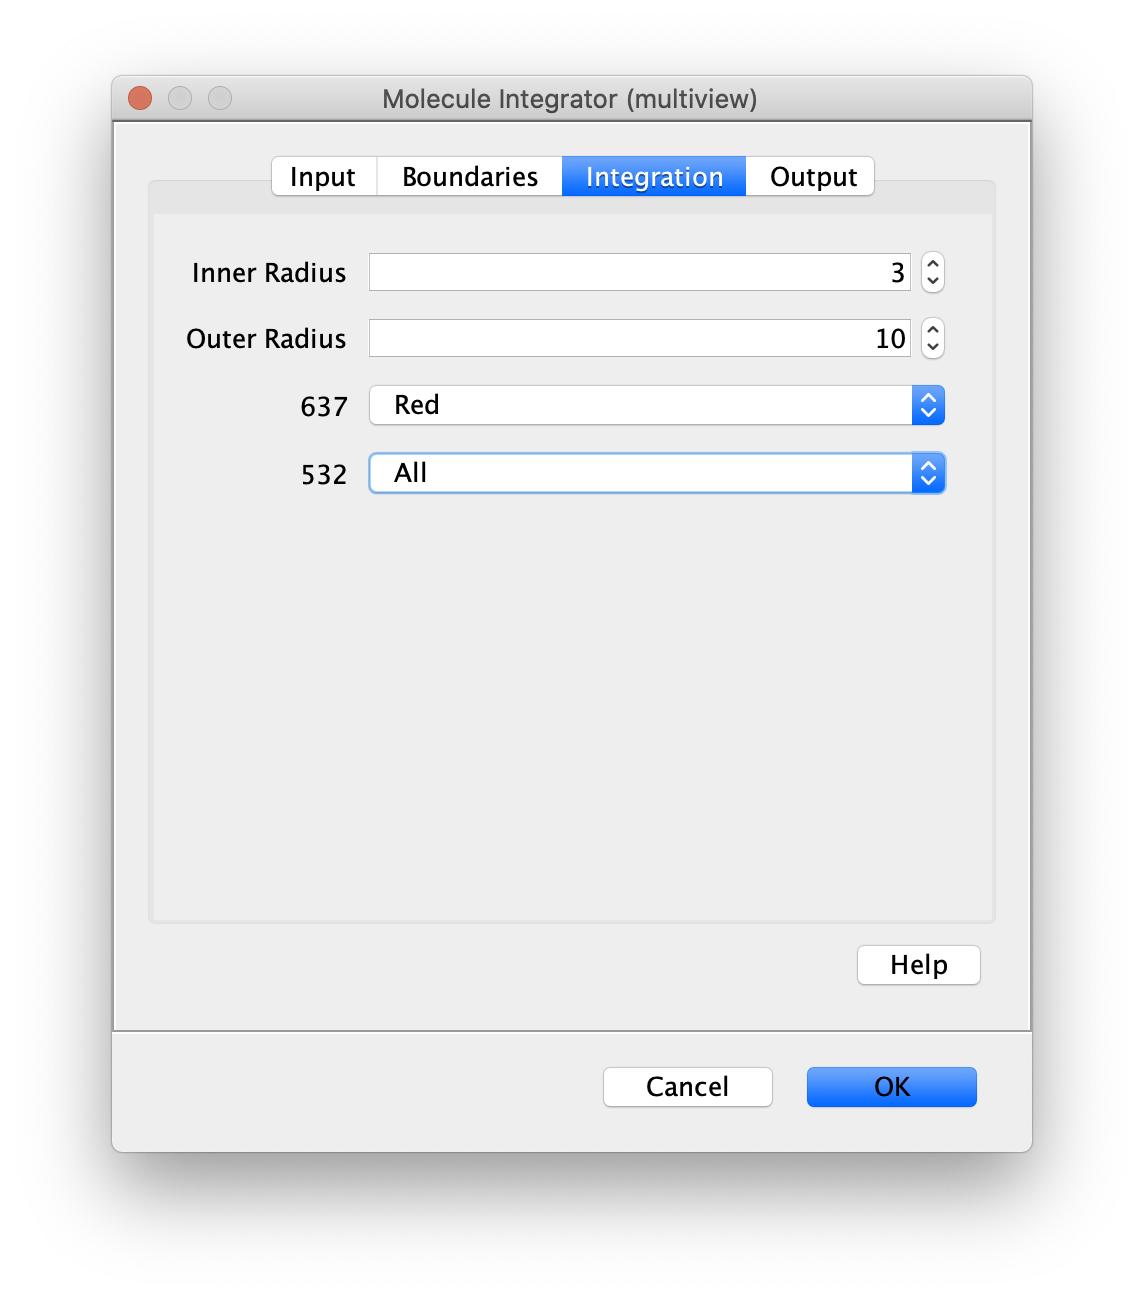
- Inner Radius - The radius of pixels around the peak to integrate. 0 means only one pixel, 1 means a radius of out beyond the center pixel and etc.
- Outer Radius - The radius of pixels around the Inner Radius to use for background correction. If the Inner Radius is 1 and the Outer Radius is 5. Then the circular region between 1 and 5 will be integrated and serve as the local background to correct the inner region.
- Channel Integration options - The desired integration regions need to be specified for each channel. Possible options are ‘Do not integrate’, ‘All’, or any specific region of the camera sensor. Channel names are used when provided. Otherwise, channel index starting from 0 is used.
As an example, the channel integration options are helpful for FRET experiments collected using ALEX (FRET and dynamic FRET). These experiments have two channels for each time point. One channel is 532 for donor excitation and FRET. The second channel is 637 for direct acceptor excitation. We select All for the 532 channel to integrate donor and acceptor signal. For the 637 channel, we select only the Red region for integration since the donor is not excited by the 637 laser. When in doubt using All for every channel and in the worst case you will have some extra columns in your molecule record tables.
Output
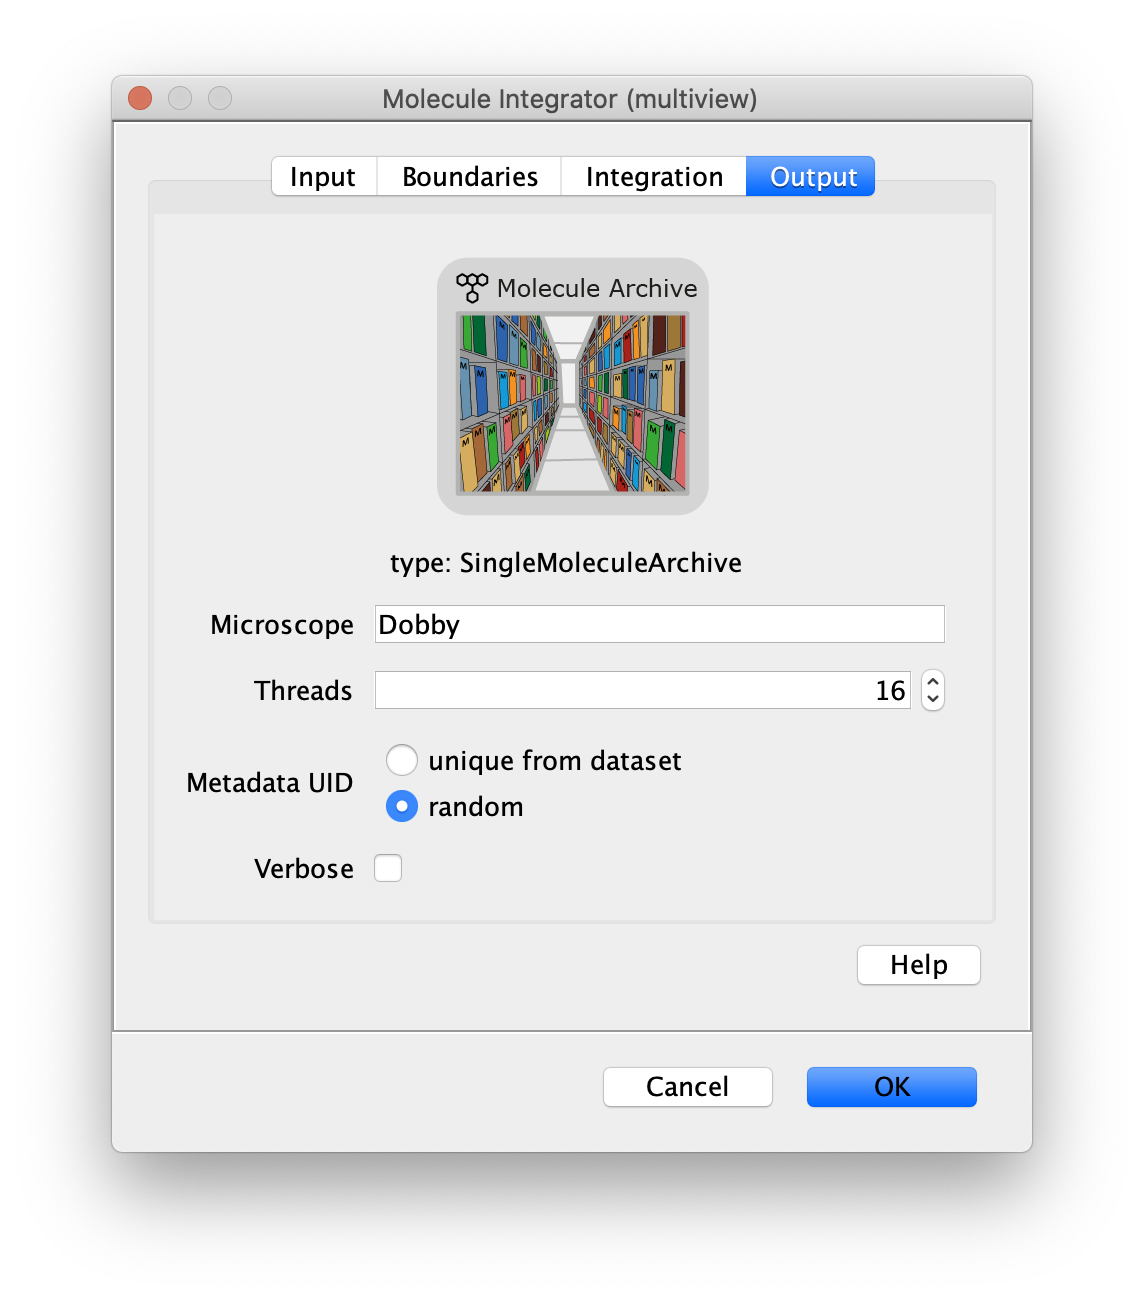
- Microscope - The microscope name added to the metadata record.
- Metadata UID - Options to either generate a metadata UID based on the metadata UID supplied in the image metadata or a new one that is random.
- Thread count - Determines how much computing power of your computer will be devoted to this calculation. A higher thread count decreases computing time.
- Verbose - This option includes extra table columns with more integration information. By default, the integrated peak signal corrected for median background and the median background used for the correction are included in the table of single molecule records generated. With the Verbose option checked, the table will also include the uncorrected integrated intensity and mean background.
The median background and mean background columns represent an estimate of the background signal within the inner radius region. First the median or mean pixel values in the outer region are calculated and then multiplied by the number of pixels in the inner region to represent an accurate estimate of the background signal in the inner region.
Result
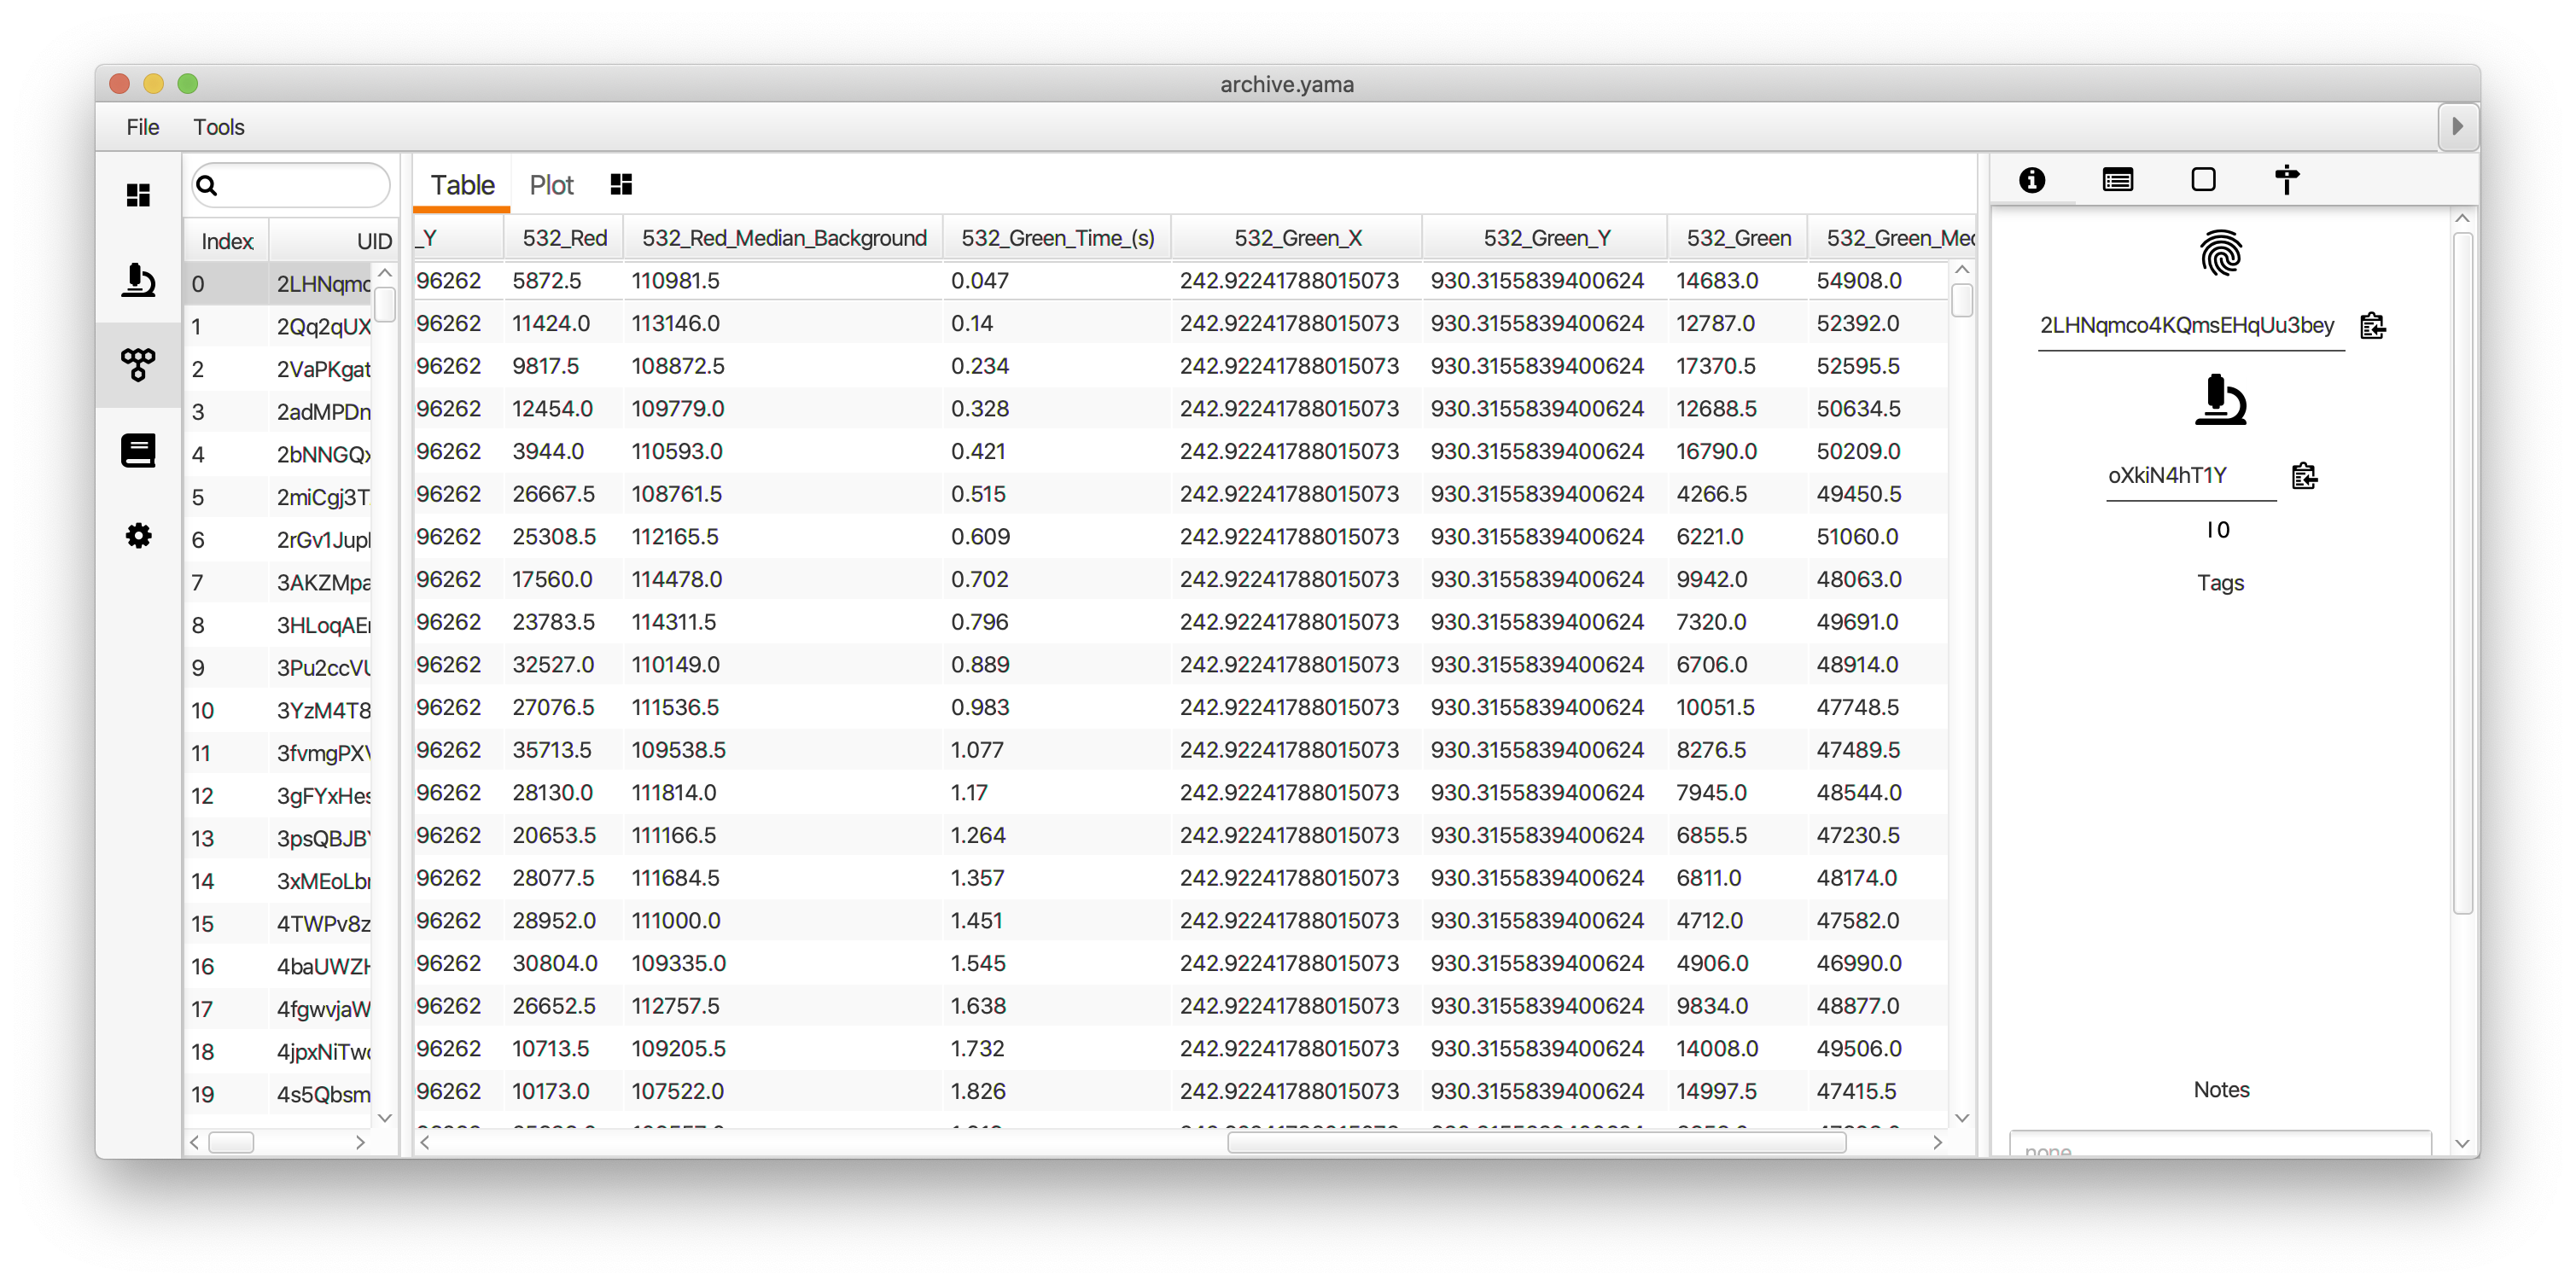
- MoleculeArchive - A Single Molecule Archive in which each molecule record has the integrated fluorescence for all channels and regions specified. Additionally, the peak position is saved for each time point (T) and Time (s) information is added if discovered.
How to run this Command from a groovy script
This example script shows how to run the Molecule Integrator (multiview) command using integration maps. This script is written for analysis of the simulated dataset that is created using the second script below. Integration maps specify all peaks that should be integrated for each time point with each peak labeled with the corresponding molecule UID. This is done by mapping timepoints to maps of UIDs to peaks Map<Integer, Map<String, Peak>> timepointToMapOfUIDToPeak = new HashMap<>().
#@ Dataset dataset
#@ ImageJ ij
#@OUTPUT MoleculeArchive(label="archive.yama") archive

import de.mpg.biochem.mars.table.*
import de.mpg.biochem.mars.molecule.*
import de.mpg.biochem.mars.image.*
import de.mpg.biochem.mars.util.*
import de.mpg.biochem.mars.image.commands.*
import java.util.HashMap
import java.util.Map

//Make an instance of the Command you want to run
final MoleculeIntegratorMultiViewCommand moleculeIntegrator = new MoleculeIntegratorMultiViewCommand()

//Populates @Parameters Services using the current context
moleculeIntegrator.setContext(ij.getContext())

moleculeIntegrator.setDataset(dataset)
moleculeIntegrator.setInnerRadius(3)
moleculeIntegrator.setOuterRadius(10)
moleculeIntegrator.setRegionBoundaries("Top", 0, 0, 50, 25)
moleculeIntegrator.setRegionBoundaries("Bottom", 0, 25, 50, 25)
moleculeIntegrator.setMicroscope("Microscope")
moleculeIntegrator.setThreads(8)
moleculeIntegrator.setVerbose(true)
moleculeIntegrator.setMetadataUIDSource("random")

//Below is an example of how to manually add the lists of peak positions
//specified for each time point

String mol1UID = MarsMath.getUUID58()
String mol2UID = MarsMath.getUUID58()
String mol3UID = MarsMath.getUUID58()

Map<Integer, Map<String, Peak>> longIntegrationMap = new HashMap<>()
for (int t = 0; t < 50; t++) {
	Map<String, Peak> peaks = new HashMap<>()
	peaks.put(mol1UID, new Peak(mol1UID, 10.0d, 10.0d))
	peaks.put(mol2UID, new Peak(mol2UID, 32.5d, 8d))
	peaks.put(mol3UID, new Peak(mol3UID, 43.7d, 16.7d))
	longIntegrationMap.put(t, peaks)
}
moleculeIntegrator.addIntegrationMap("FRET Red", 0, moleculeIntegrator.getInterval("Top"), longIntegrationMap)

Map<Integer, Map<String, Peak>> longIntegrationMap2 = new HashMap<>()
for (int t = 0; t < 50; t++) {
	Map<String, Peak> peaks = new HashMap<>()
	peaks.put(mol1UID, new Peak(mol1UID, 10.0d, 10.0d))
	peaks.put(mol2UID, new Peak(mol2UID, 32.5d, 8d))
	peaks.put(mol3UID, new Peak(mol3UID, 43.7d, 16.7d))
	longIntegrationMap2.put(t, peaks)
}
moleculeIntegrator.addIntegrationMap("Red", 2, moleculeIntegrator.getInterval("Top"), longIntegrationMap2)

Map<Integer, Map<String, Peak>> shortIntegrationMap = new HashMap<>()
for (int t = 0; t < 50; t++) {
	Map<String, Peak> peaks = new HashMap<>();
	peaks.put(mol1UID, new Peak(mol1UID, 10.0d, 35d))
	peaks.put(mol2UID, new Peak(mol2UID, 32.5d, 33d))
	peaks.put(mol3UID, new Peak(mol3UID, 43.7d, 41.7d))
	shortIntegrationMap.put(t, peaks)
}
moleculeIntegrator.addIntegrationMap("FRET Green", 0, moleculeIntegrator.getInterval("Bottom"), shortIntegrationMap)

Map<Integer, Map<String, Peak>> shortIntegrationMap2 = new HashMap<>()
for (int t = 0; t < 50; t++) {
	Map<String, Peak> peaks = new HashMap<>()
	peaks.put(mol1UID, new Peak(mol1UID, 10.0d, 35d))
	peaks.put(mol2UID, new Peak(mol2UID, 32.5d, 33d))
	peaks.put(mol3UID, new Peak(mol3UID, 43.7d, 41.7d))
	shortIntegrationMap2.put(t, peaks)
}
moleculeIntegrator.addIntegrationMap("Blue", 1, moleculeIntegrator.getInterval("Bottom"), shortIntegrationMap2)

//Run the Command
moleculeIntegrator.run()

//Retrieve output from the command
archive = moleculeIntegrator.getArchive()
This script is used to generate a simulated dataset with several peaks in several channels, including corresponding peaks on the top and bottom of the images similar to that expected when using a dual-view setup.
#@ DatasetService datasetService
#@OUTPUT Dataset dataset

import net.imagej.Dataset
import net.imagej.DatasetService
import net.imagej.axis.Axes
import net.imagej.axis.AxisType
import de.mpg.biochem.mars.util.Gaussian2D

long[] dim = new long[4]
dim[0] = 50
dim[1] = 50
dim[2] = 3
dim[3] = 50

AxisType[] axes = new AxisType[4]
axes[0] = Axes.X
axes[1] = Axes.Y
axes[2] = Axes.CHANNEL
axes[3] = Axes.TIME

dataset = datasetService.create(dim, "Simulated Image", axes, 16,
	false, false);

for (int t = 0; t < dim[3]; t++)
	for (int x = 0; x < dim[0]; x++)
		for (int y = 0; y < dim[1]; y++) {
			Gaussian2D peak1 = new Gaussian2D(0, Math.cos(Math.PI * t / 10) *
				2000d + 2000d, 10.0d, 10.0d, 1.2d);
			Gaussian2D peak2 = new Gaussian2D(0, Math.cos(Math.PI * t / 10) *
				2000d + 2000d, 32.5d, 8d, 1.2d);
			Gaussian2D peak3 = new Gaussian2D(0, Math.cos(Math.PI * t / 10) *
				2000d + 2000d, 43.7d, 16.7d, 1.2d);
			Gaussian2D peak4 = new Gaussian2D(0, Math.sin(Math.PI * t / 10) *
				2000d + 2000d, 10.0d, 35d, 1.2d);
			Gaussian2D peak5 = new Gaussian2D(0, Math.sin(Math.PI * t / 10) *
				2000d + 2000d, 32.5d, 33d, 1.2d);
			Gaussian2D peak6 = new Gaussian2D(0, Math.sin(Math.PI * t / 10) *
				2000d + 2000d, 43.7d, 41.7d, 1.2d);

			dataset.getImgPlus().randomAccess().setPositionAndGet(x, y, 0, t)
				.setReal(peak1.getValue(x, y) + peak2.getValue(x, y) + peak3
					.getValue(x, y) + peak4.getValue(x, y) + peak5.getValue(x, y) +
					peak6.getValue(x, y));

			Gaussian2D peak7 = new Gaussian2D(0, Math.sin(Math.PI * t / 5) *
				500d + 2500d, 10.0d, 35d, 1.2d);
			Gaussian2D peak8 = new Gaussian2D(0, Math.sin(Math.PI * t / 5) *
				500d + 2500d, 32.5d, 33d, 1.2d);
			Gaussian2D peak9 = new Gaussian2D(0, Math.sin(Math.PI * t / 5) *
				500d + 2500d, 43.7d, 41.7d, 1.2d);
			dataset.getImgPlus().randomAccess().setPositionAndGet(x, y, 1, t)
				.setReal(peak7.getValue(x, y) + peak8.getValue(x, y) + peak9
					.getValue(x, y));

			Gaussian2D peak10 = new Gaussian2D(0, Math.sin(Math.PI * t / 5) *
				500d + 2500d, 10.0d, 10.0d, 1.2d);
			Gaussian2D peak11 = new Gaussian2D(0, Math.sin(Math.PI * t / 5) *
				500d + 2500d, 32.5d, 8d, 1.2d);
			Gaussian2D peak12 = new Gaussian2D(0, Math.sin(Math.PI * t / 5) *
				500d + 2500d, 43.7d, 16.7d, 1.2d);
			dataset.getImgPlus().randomAccess().setPositionAndGet(x, y, 2, t)
				.setReal(peak10.getValue(x, y) + peak11.getValue(x, y) + peak12
					.getValue(x, y));
		}