Peak Finder
This command is used to find high intensity spots or peaks in images. Typically these are single polystyrene beads or single fluorescent dyes or groups of dyes. After locating the peaks, this command can perform 2D Gaussian fitting to determine the sub-pixel position of the peaks. This command can be integrated in many workflows where general purpose peak detection is required. For example, this is used to find molecules in single-molecule FRET experiments that are subsequently integrated using the MoleculeIntegrator to generate Molecule Archives for smFRET analysis.
Input
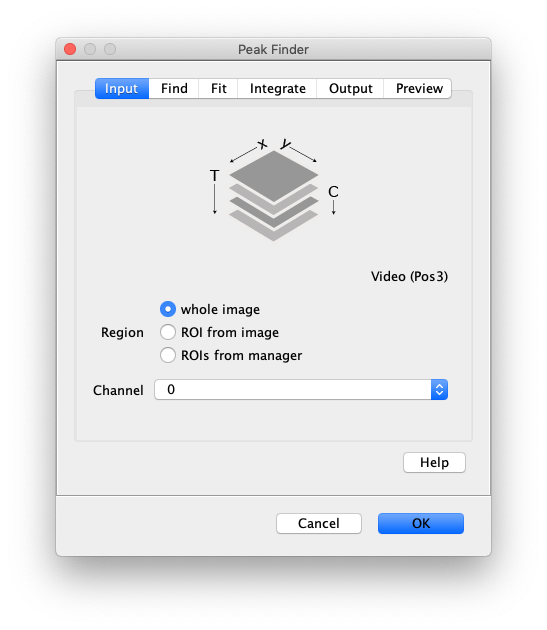
- Image - The active image selected will be used by the Peak Finder. The name of this image or video is displayed underneath the stack in the ‘Input’ tab.
- Region - Apply the tool to either the ‘whole image’, an ‘ROI from image’ or ‘ROIs from manager’.
- Channel - Select which channel to analyze in case a video with multiple channels is provided as input.
Find
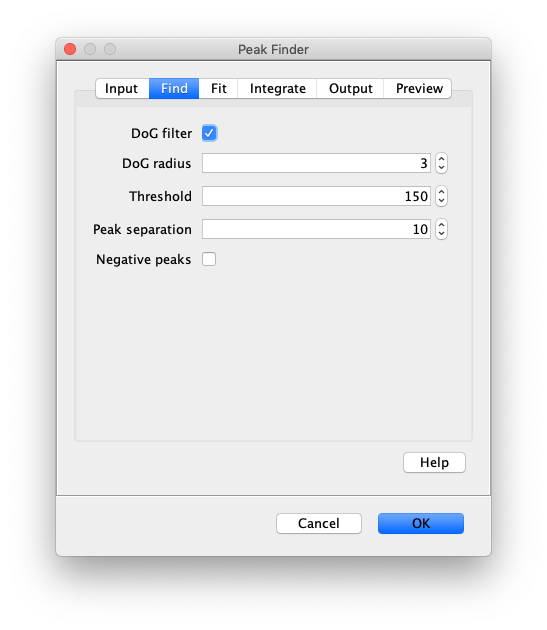
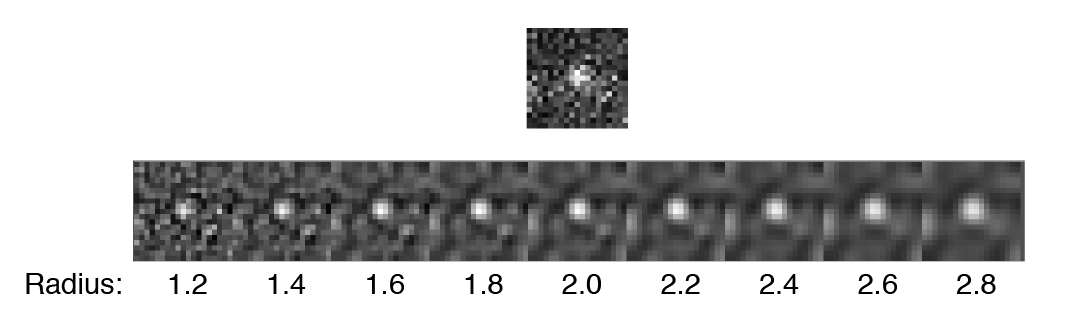
- DoG filter - If checked the image will be processed with a Difference of Gaussian (DoG) filter before peak finding. Using an appropriately chosen radius this filter enhances real peaks with signal spread among several pixels and suppresses salt and pepper noise as demonstrated in this systematic study. If unchecked the raw image will be used for peak finding.
- DoG radius - The radius used for DoG filtering. The value chosen should reflect the size of the desired peaks. Decimal numbers are permitted.
- Threshold - This is threshold in pixel value used for peak detection. Pixels with values above this threshold are considered peaks and pixels below this threshold are considered background. For everyday peak detection, the DoG filter should be used in which case this threshold using on the DoG filtered image. In this case, we have found that values between 40 and 60 provide optimal detection for typical single-molecule observations. If the DoG Filter is turned off this threshold reflects raw pixel values in the input image.
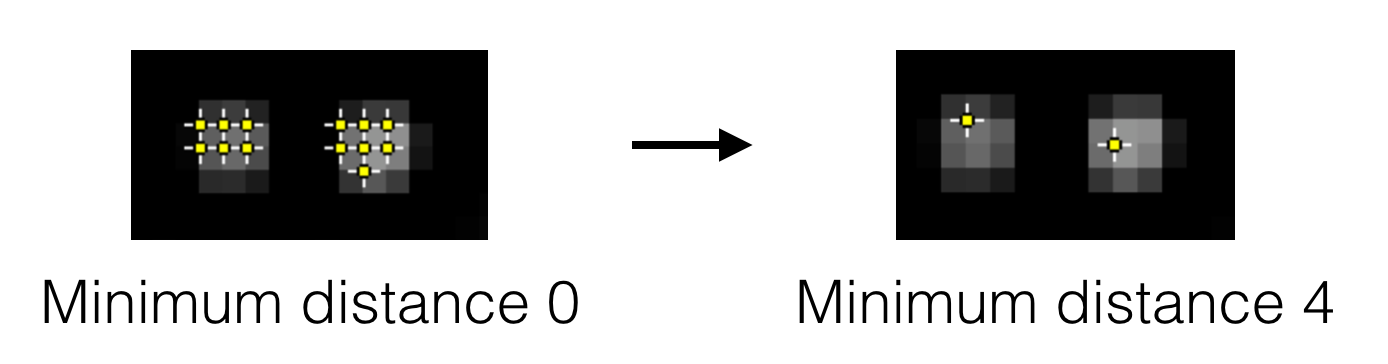
- Peak separation - This is the minimum allowed distance between peaks. This means only the pixel with the highest intensity within this radius will be accepted as a peak, even if there are other pixels above the threshold within this radius region. This is an important setting since most peaks have nearby pixels that are also above the detection threshold, but we only want to detect each peak once. See the image below for an example.
- Negative peaks - If checked peak with negative pixel values are detected. This can be used in gradient images, where a negative gradient results in a negative peak. This is useful for detecting the edges of long DNA molecules and other structures.
Fit
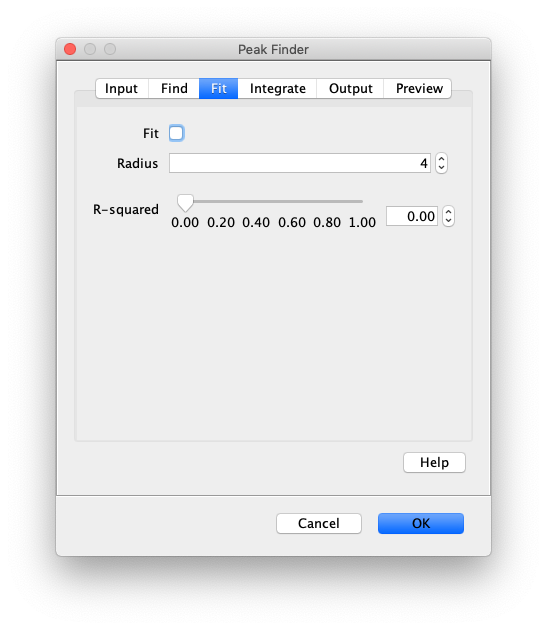
- Fit - If checked all peaks will be fit with 2D Gaussians to determine the sub pixel position. If left unchecked, all the remaining settings will be ignored and the peaks will be reported with their integer pixel positions. Fitting is done with the following 2D Gaussian equation:
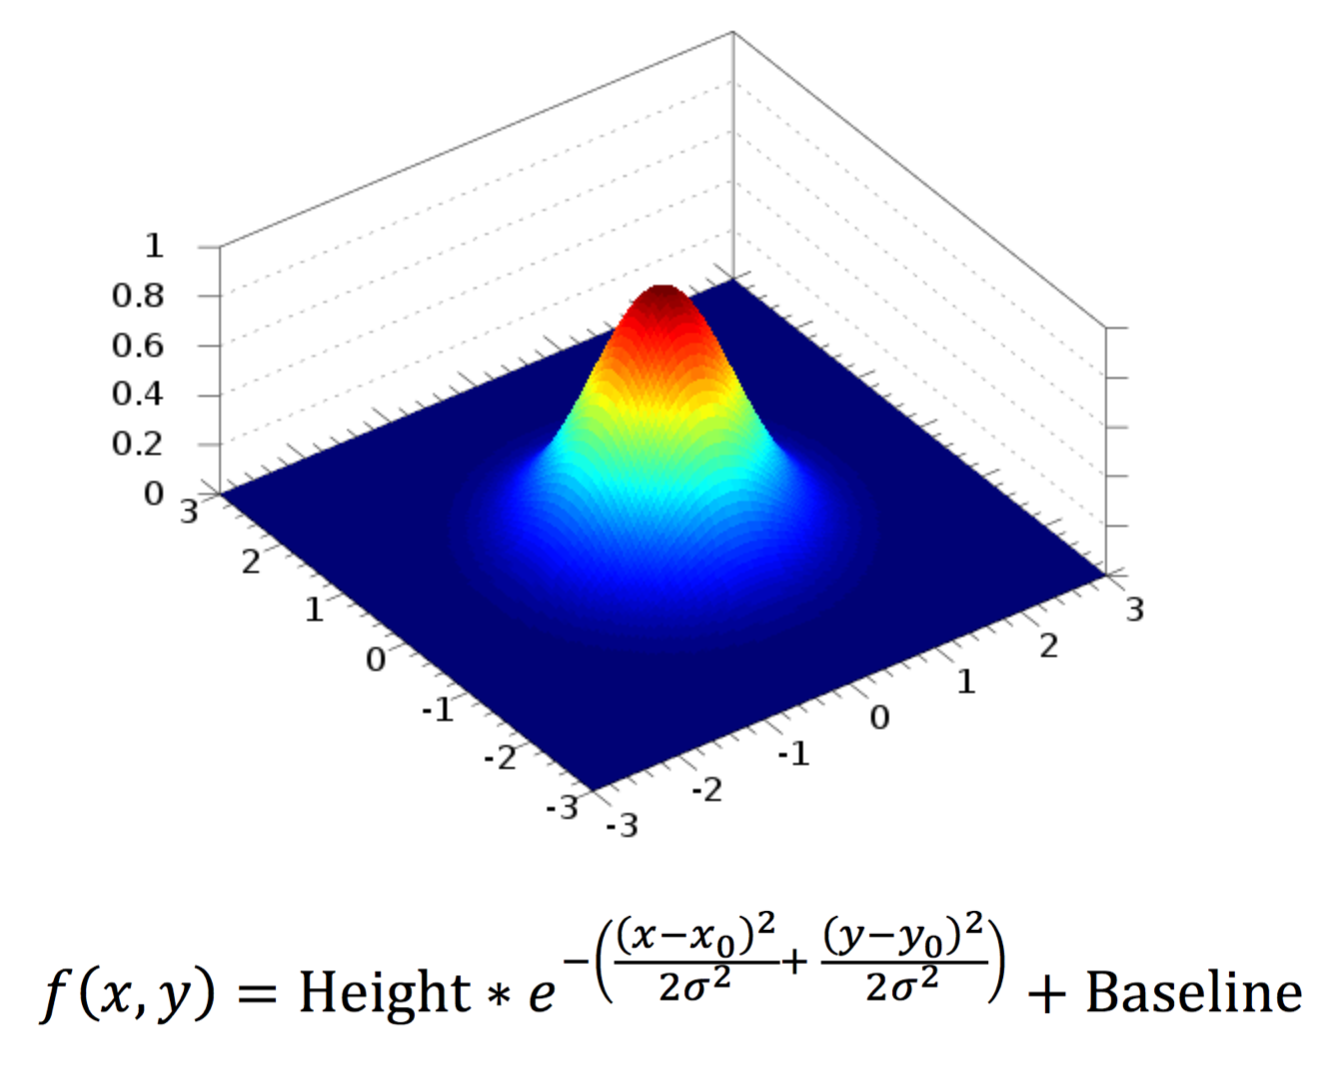
Where x0 and y0 are the subpixel positions of a peak with a given height, baseline and sigma. f(x,y) then gives the intensity as a function of pixel position.
- Fit Radius - The radius of pixels used for peak fitting. 0 is one pixel, 1 is 9 pixels, 2 is 25 pixels. Usually 3 or 4 is a good estimate depending for typical single-molecule observations. Optimal fitting is done using a region with background pixels at the edges.
- Minimum R-squared - Caution: This should remain set to 0.0 unless there is a very good reason to filter poor fits. Normal single-molecule data has a broad range of R-squared values. This input is the minimum allowed value of R-squared resulting from peak fitting. R-squared is defined as 1 - SSres / SStot to match the definition used in Prism as defined here with 1.0 for perfect fits and 0.0 for fits no better than a straight line. Typical single-molecule images are noisy leading to large variation in R-squared values so this threshold should only be used as an additional step if further peak rejection is required.
Integrate
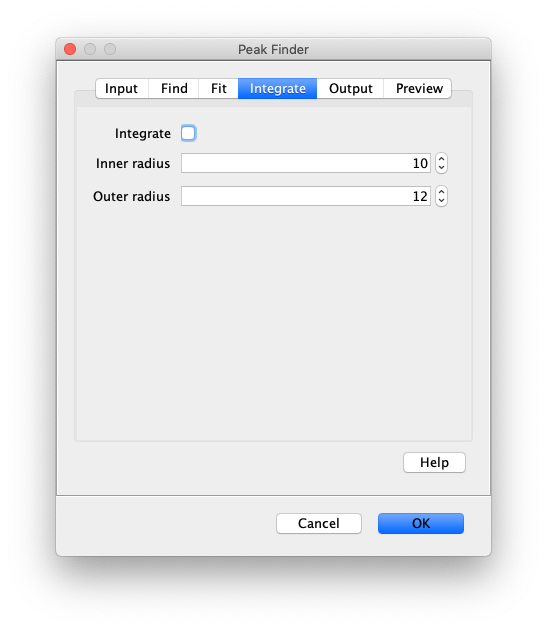
- Integrate - Integrate the peak intensities and add them to the peaks table as an intensity column. Adds up the total intensity of the inner region with the median background subtracted from each pixel. The median background is calculated from the background region.
- Inner radius - The radius of the region to integrate around the center of the peak. 0 is one pixel, 1 is 9 pixels, 2 is 25 pixels. Typically 1 is a good value but this depends on the size of molecules on the camera sensor.
- Outer radius - The radius of the region to use for calculating the local median background. This is subtracted from the inner region. Typically 3 is a good value. This radius should be ~2 pixels larger than the inner radius.
Output
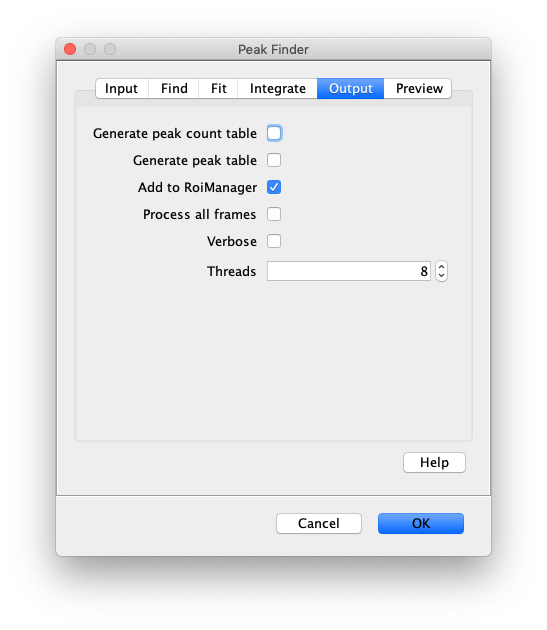
- Generate peak count table - If checked a table will appear in which each row has the number of detected peaks for each slice. This is useful to look at bead loss as a function of time in the bead assays and bleaching for a given intensity in smTIRF data.
- Generate peak table - If checked a table will be generated listing the positions of all detected peaks.
- Add to ROIManager - If checked detected peaks will be added to the RoiManager. This is useful for further processing such as transforming peaks between dual view regions and integrating peaks with the Molecule Integrator.
- Process all frames - If checked all frames in the video will be analyzed. If unchecked only the current frame is analyzed.
- Verbose output - If checked all fit parameters are included in the output (baseline, height, x, y, sigma, R2). If unchecked only the position, slice, intensity columns will be included in the output. Verbose output can be used to optimise the R-squared minimum, or for calculations based on peak properties.
- Thread count - Determines how much computing power of your computer will be devoted to this calculation. A higher thread count decreases computing time.
Preview
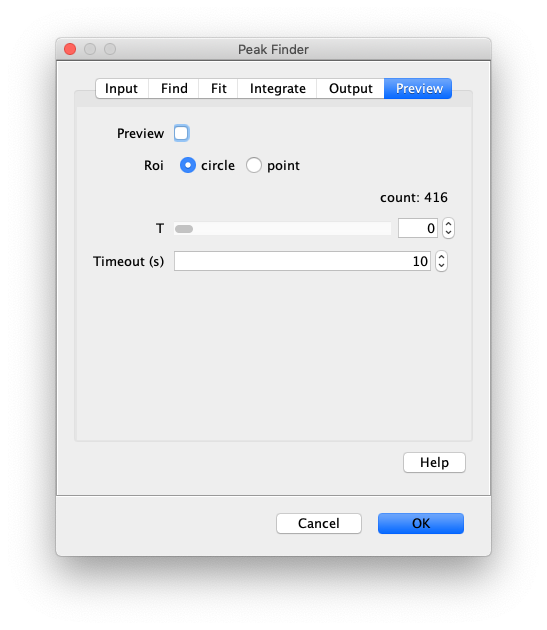
- Preview - When checked ROIs will appear on all detected peaks given for the current setting. This is very useful for finding the correct settings that detect just enough peaks without too much background. This will live update as parameters are changed, such as the detection threshold. This is used before running the command to confirm you have the correct settings. This only detects peaks at the pixel level and doesn’t do any fitting. The peak count is reported below. Note - the peak count reported is form the previous preview due to an UI update issue. Turning on and off the preview will ensure everything is up-to-date.
- Preview Roi - This sets the type of roi displayed in preview mode, either circle or point. If circle is chosen the radius of the circle will be the Fit Radius described below.
- T - Select the time point (T) to show peak finding results on in the video.
- Preview timeout(s) - Maximum computing time allowed to calculate the preview of the settings. If the video is too large or the settings are way off the computing time could become rather significant causing a crash of the system. Setting this limit prevents that.
Result
Several different kinds of results are possible depending on the settings used.
- Generate peak count table - If checked a table will appear in which each row has the number of detected peaks for each slice.
- Generate peak table - If checked a table will be generated listing the positions of all detected peaks.
- Add to RoiManager - If checked detected peaks will be added to the RoiManager.
How to run this Command from a groovy script
#@ Dataset dataset
#@OUTPUT MarsTable peakTable
#@ ImageJ ij

import de.mpg.biochem.mars.table.*
import de.mpg.biochem.mars.image.commands.*

//Make an instance of the Command you want to run...
PeakFinderCommand peakFinder = new PeakFinderCommand()

//Populates @Parameters Services etc.. using the current context
//which we get from the ImageJ input...
peakFinder.setContext(ij.getContext())

peakFinder.setDataset(dataset)
peakFinder.setUseRoi(false)
peakFinder.setChannel(0)
peakFinder.setUseDogFiler(true)
peakFinder.setDogFilterRadius(1.8)
peakFinder.setThreshold(50)
peakFinder.setMinimumDistance(4)
peakFinder.setT(0)
peakFinder.setFindNegativePeaks(false)
peakFinder.setGeneratePeakCountTable(false)
peakFinder.setGeneratePeakTable(true)
peakFinder.setAddToRoiManager(false)
peakFinder.setProcessAllFrames(true)
peakFinder.setFitPeaks(true)
peakFinder.setFitRadius(4)
peakFinder.setMinimumRsquared(0)
peakFinder.setIntegrate(true)
peakFinder.setIntegrationInnerRadius(1)
peakFinder.setIntegrationOuterRadius(3)
peakFinder.setVerboseOutput(false)
peakFinder.setRoiType("circle")

//Run the Command
peakFinder.run();

//Retrieve output from the command
//peakCountTable = peakFinder.getPeakCountTable()

peakTable = peakFinder.getPeakTable()

//The other possible output is adding the peaks to the RoiManager
//in which the RoiManager can then be use for further steps.
//However, keep in mind the RoiManager will probably not work
//in headless mode.