DoG Filter Properties
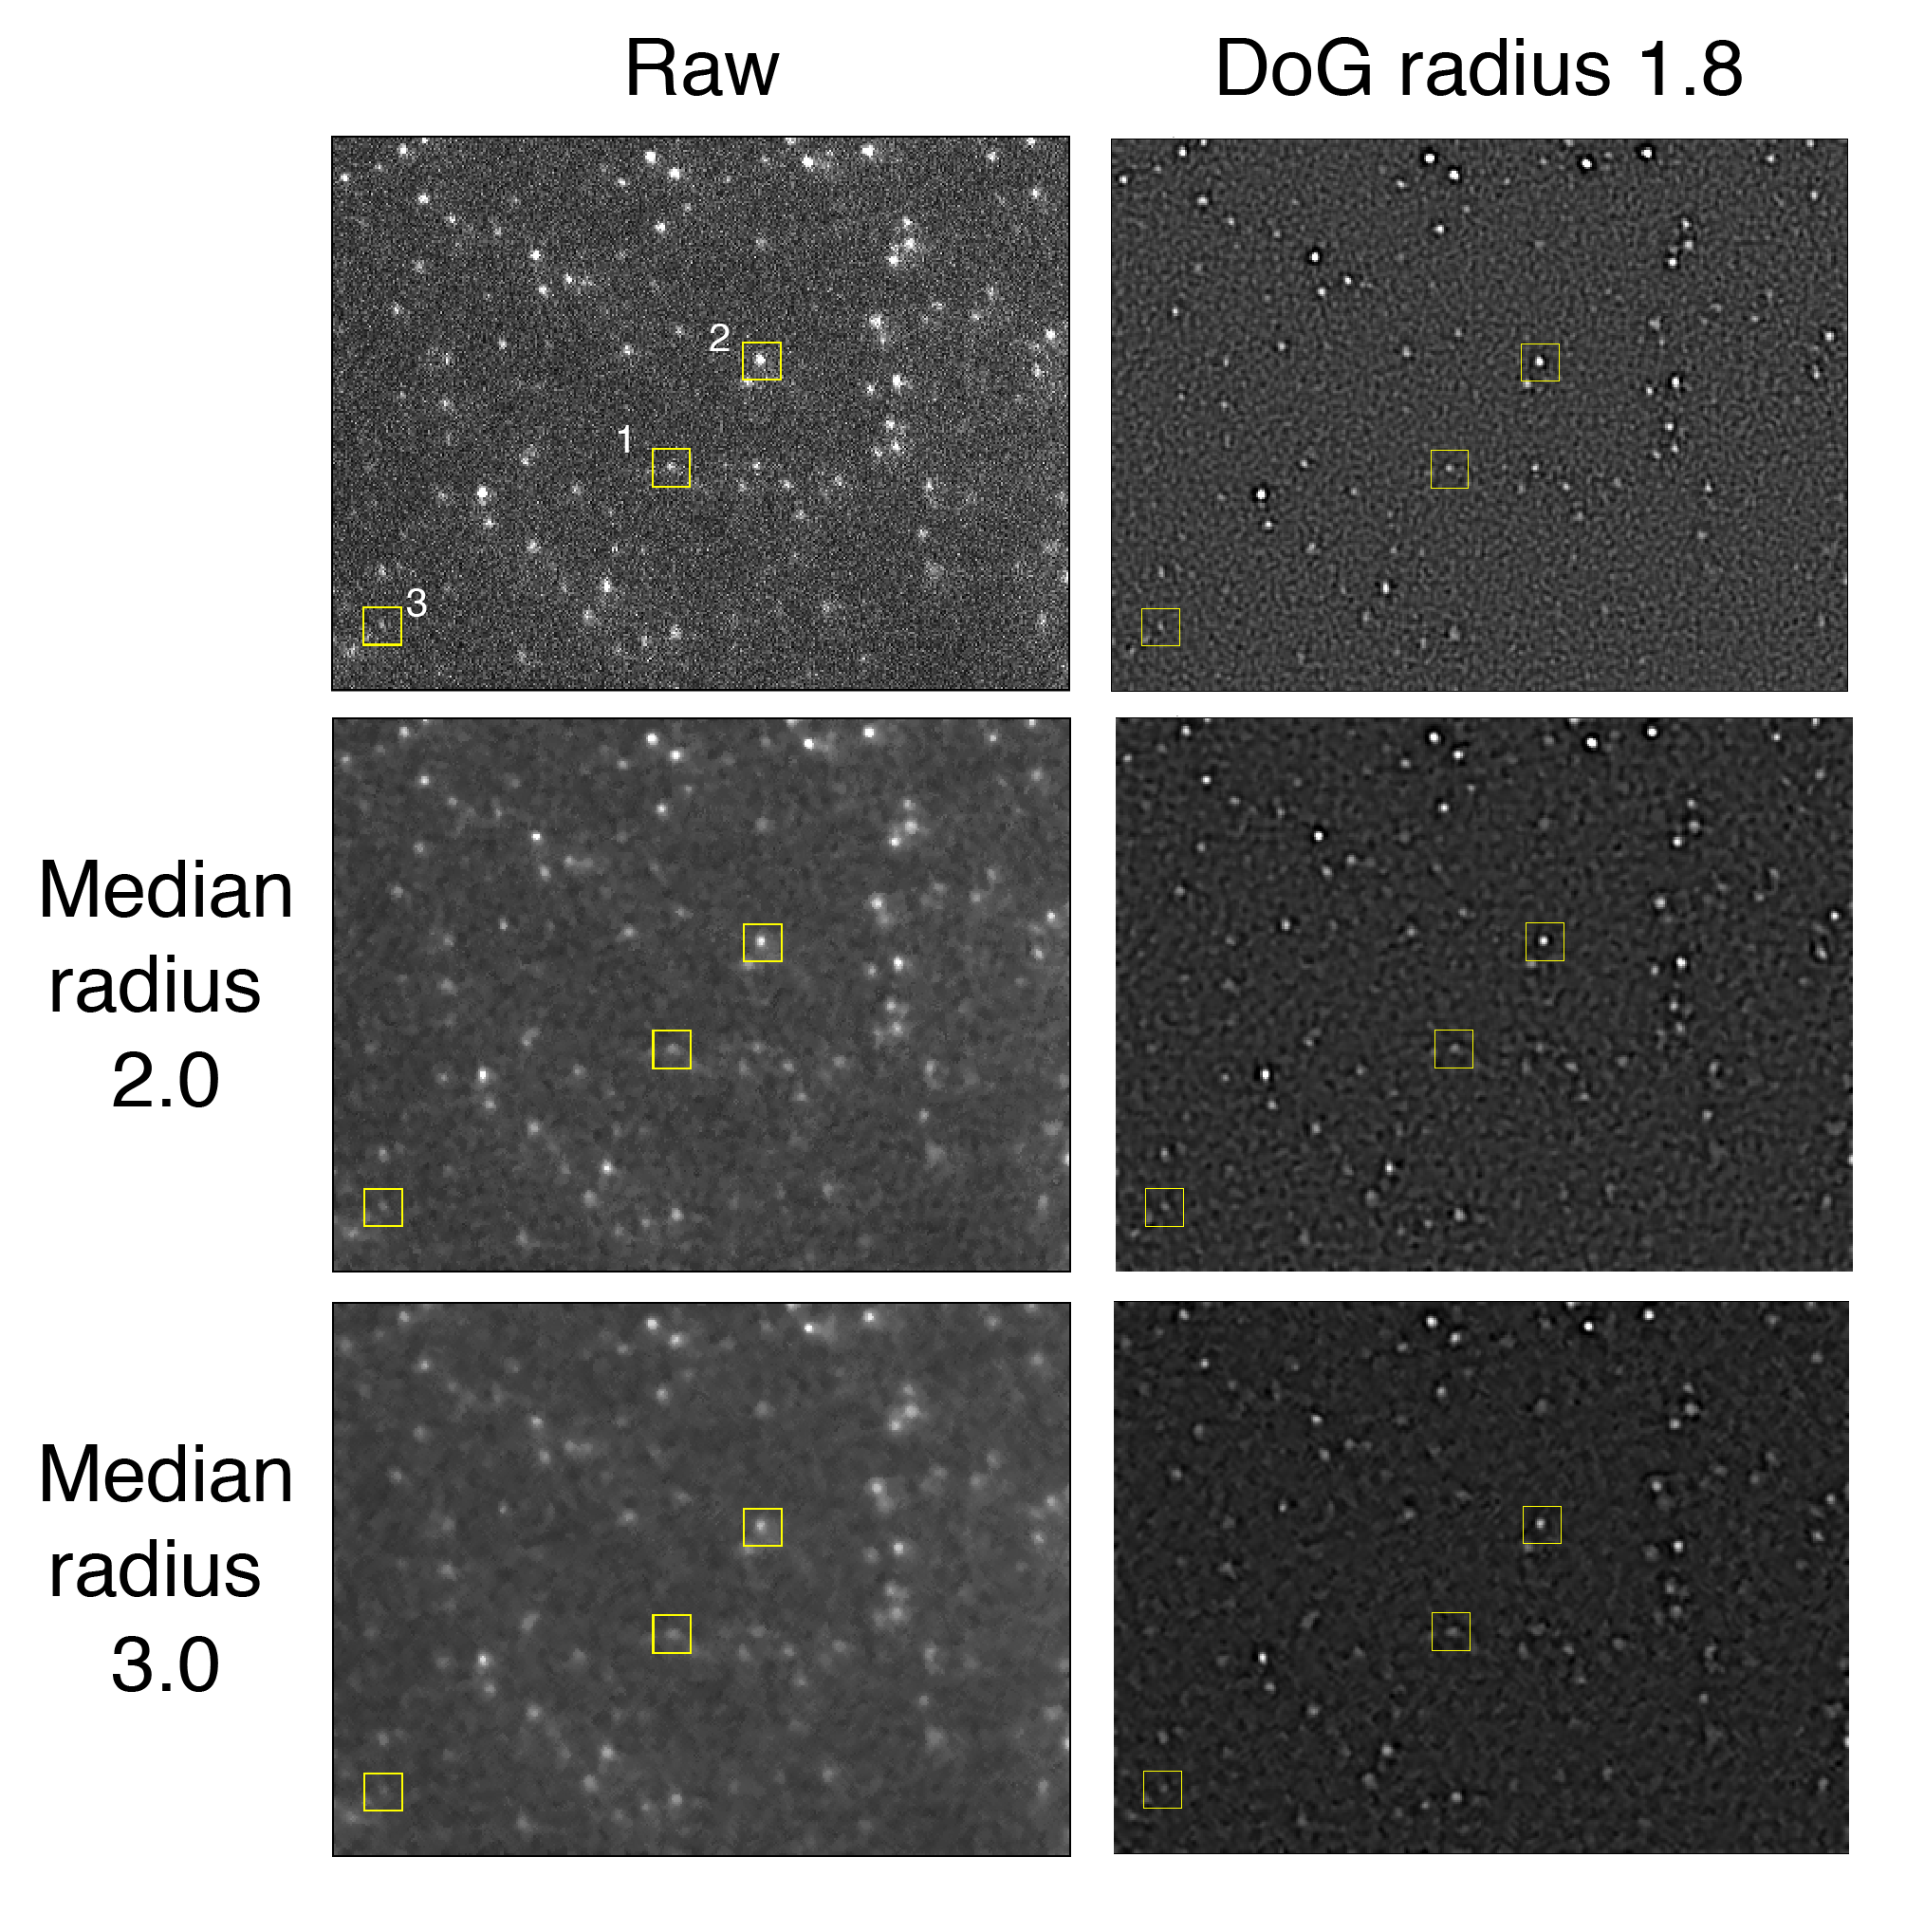
The Difference of Gaussians (DoG) filter enhances peaks by applying Gaussian convolutions (blur) with different sigmas to two image copies. The final filtered image is calculated by taking the difference between the two Gaussian convolutions. Hence the name difference of gaussian. This algorithm works especially well for enhancing single fluorescent molecules imaged in TIRF experiments as seen in the images below. Additionally, if the image is very noisy, a median filter can be applied prior to applying a DoG filter. However, this does not appear to make a significant difference in the example image evaluated below.
This filter is conveniently available as an image op in ImageJ2. Several examples of applications of the DoG filter can be found in the jupyter notebooks provided with the ImageJ tutorials. The scripts used to generate the figures below can be found at the bottom and the example data is available in the mars-tutorials repository.
Peak enhancement
To assess the peak enhancement as a function of DoG radius, three peaks with different intensities were systematically evaluated for a range of radii. The resulting images as displayed together with their x position profiles. Clearly a radius of 1.8 is the winner in terms of overall enhancement. The y-axis values provide a rough estimates of the threshold to use to ensure peak detection and reduce background.
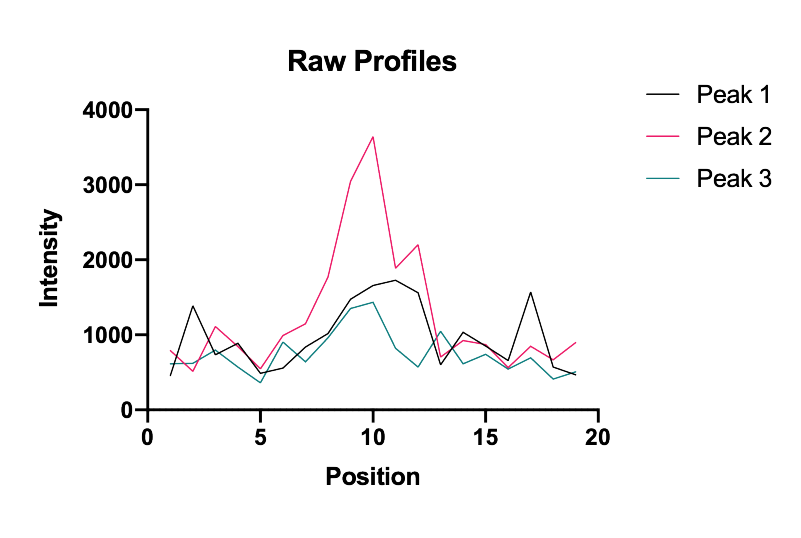
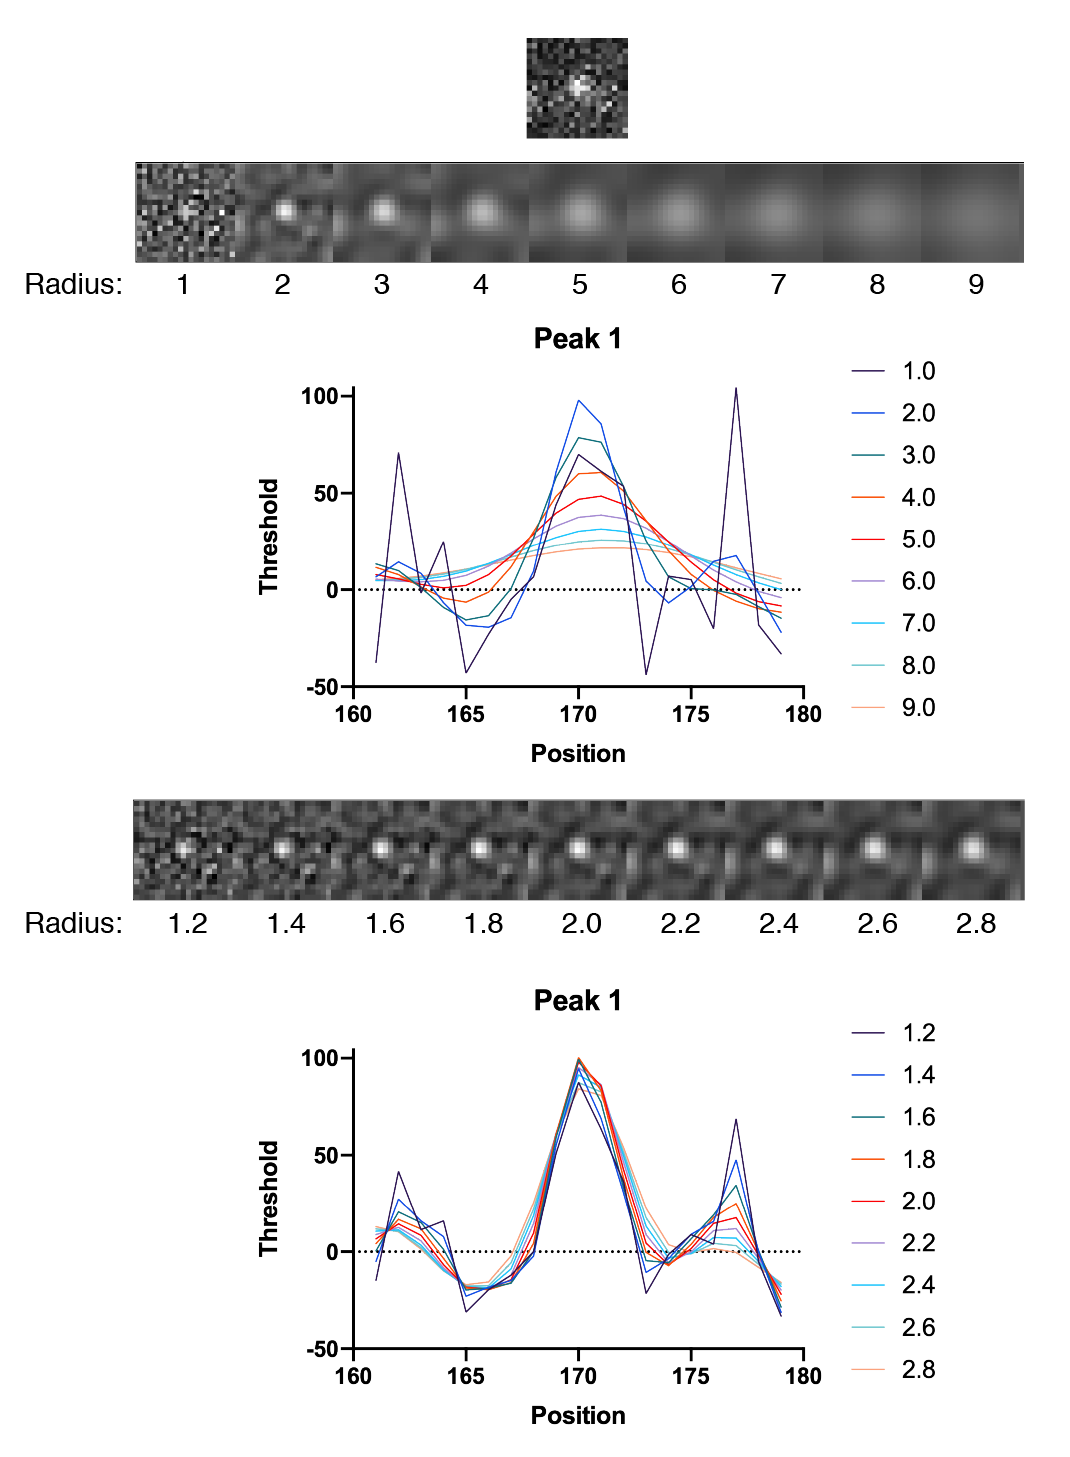
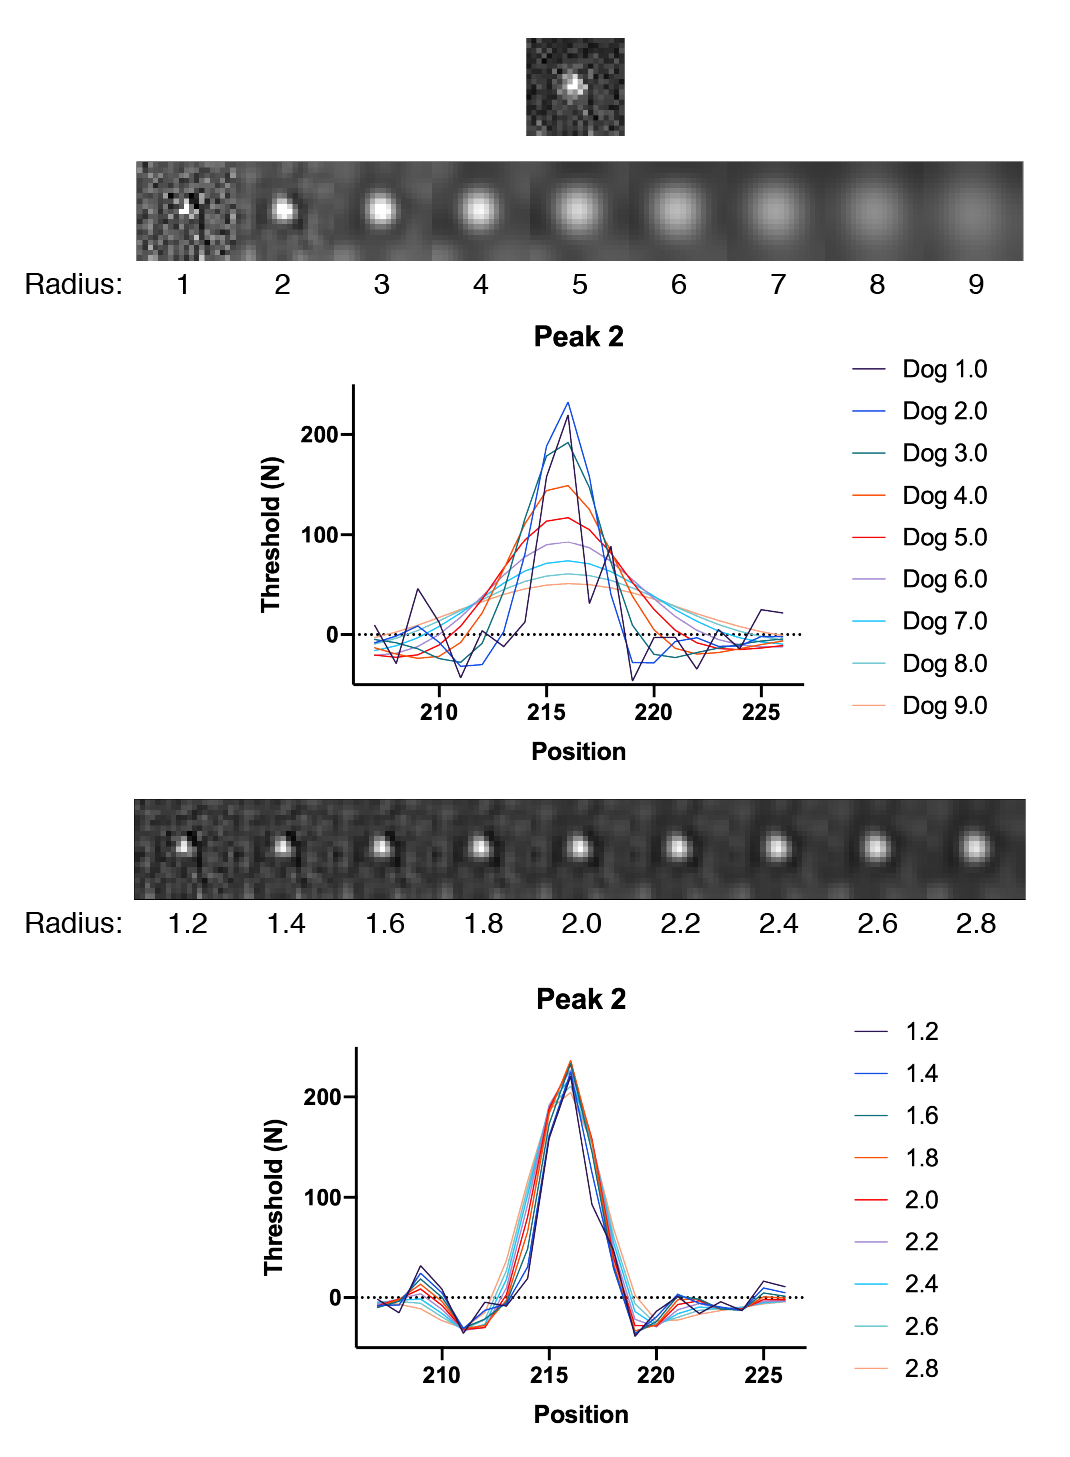
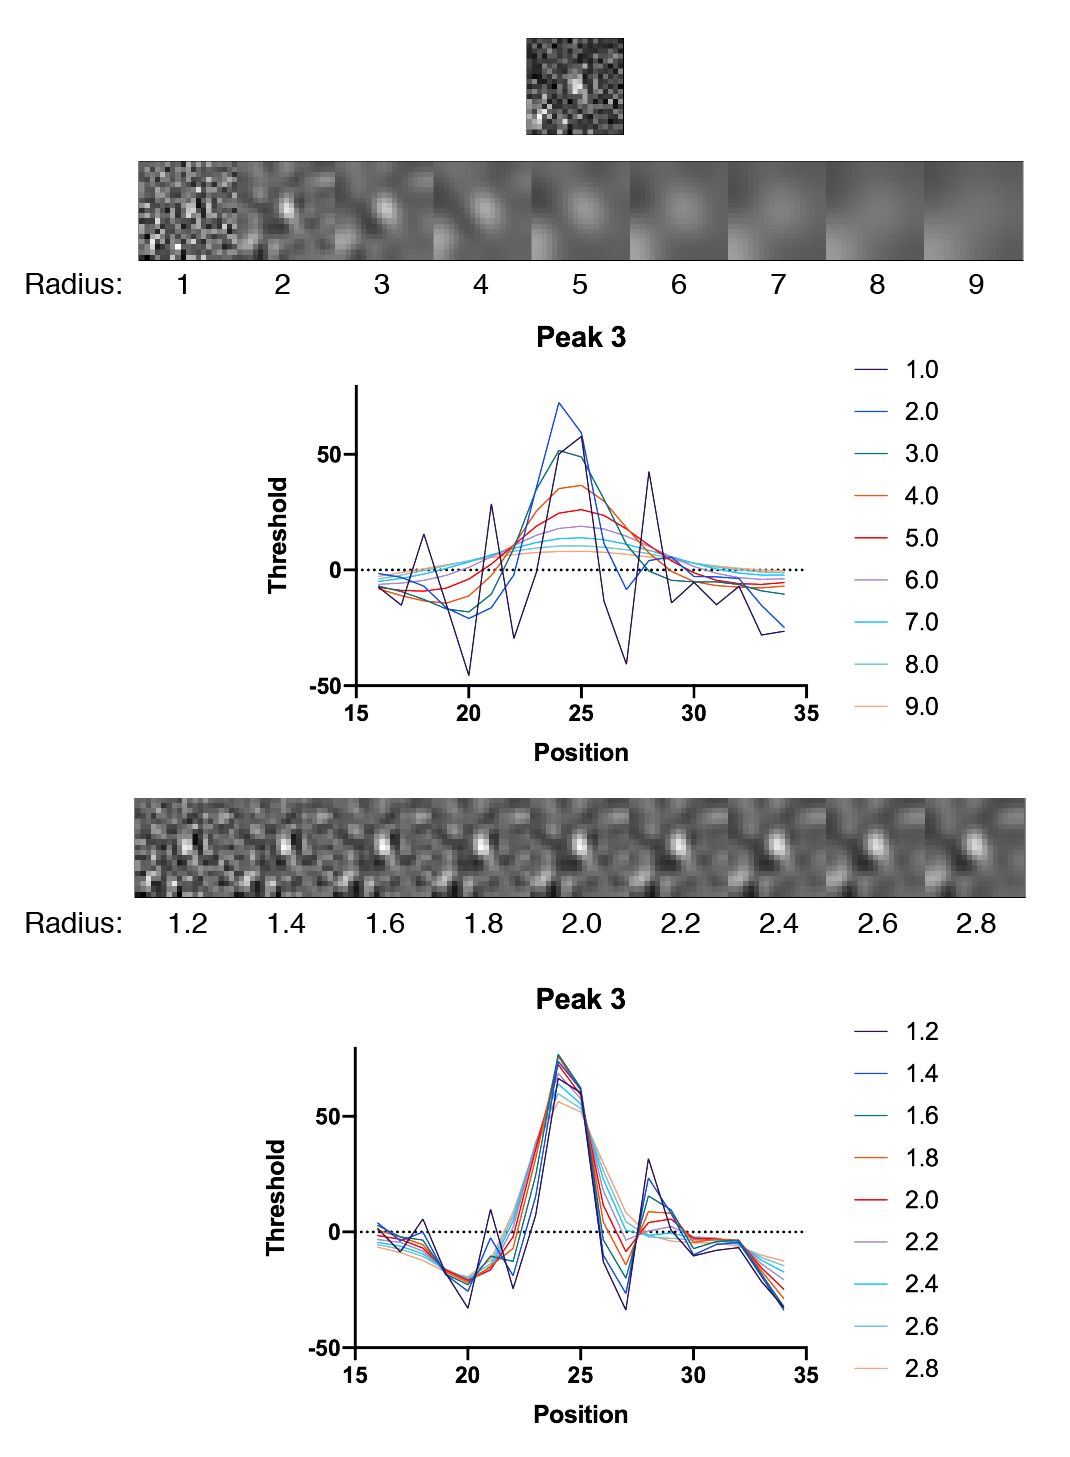
In all cases the DoG Filter improves detection. More importantly, the background is suppressed. This is particularly clear for peak 1 which has two pixels with high values are on either side of the peak. The detection threshold for these individual background pixels is dramatically reduced after DoG filtering. The optimal DoG radius for the example image tested is around 1.8, but the radius that gives the best enhancement is different for peaks of different sizes as expected (1.8 for peak 1, 1.8 for peak 2, and 1.6 for peak 3).
Peak detection
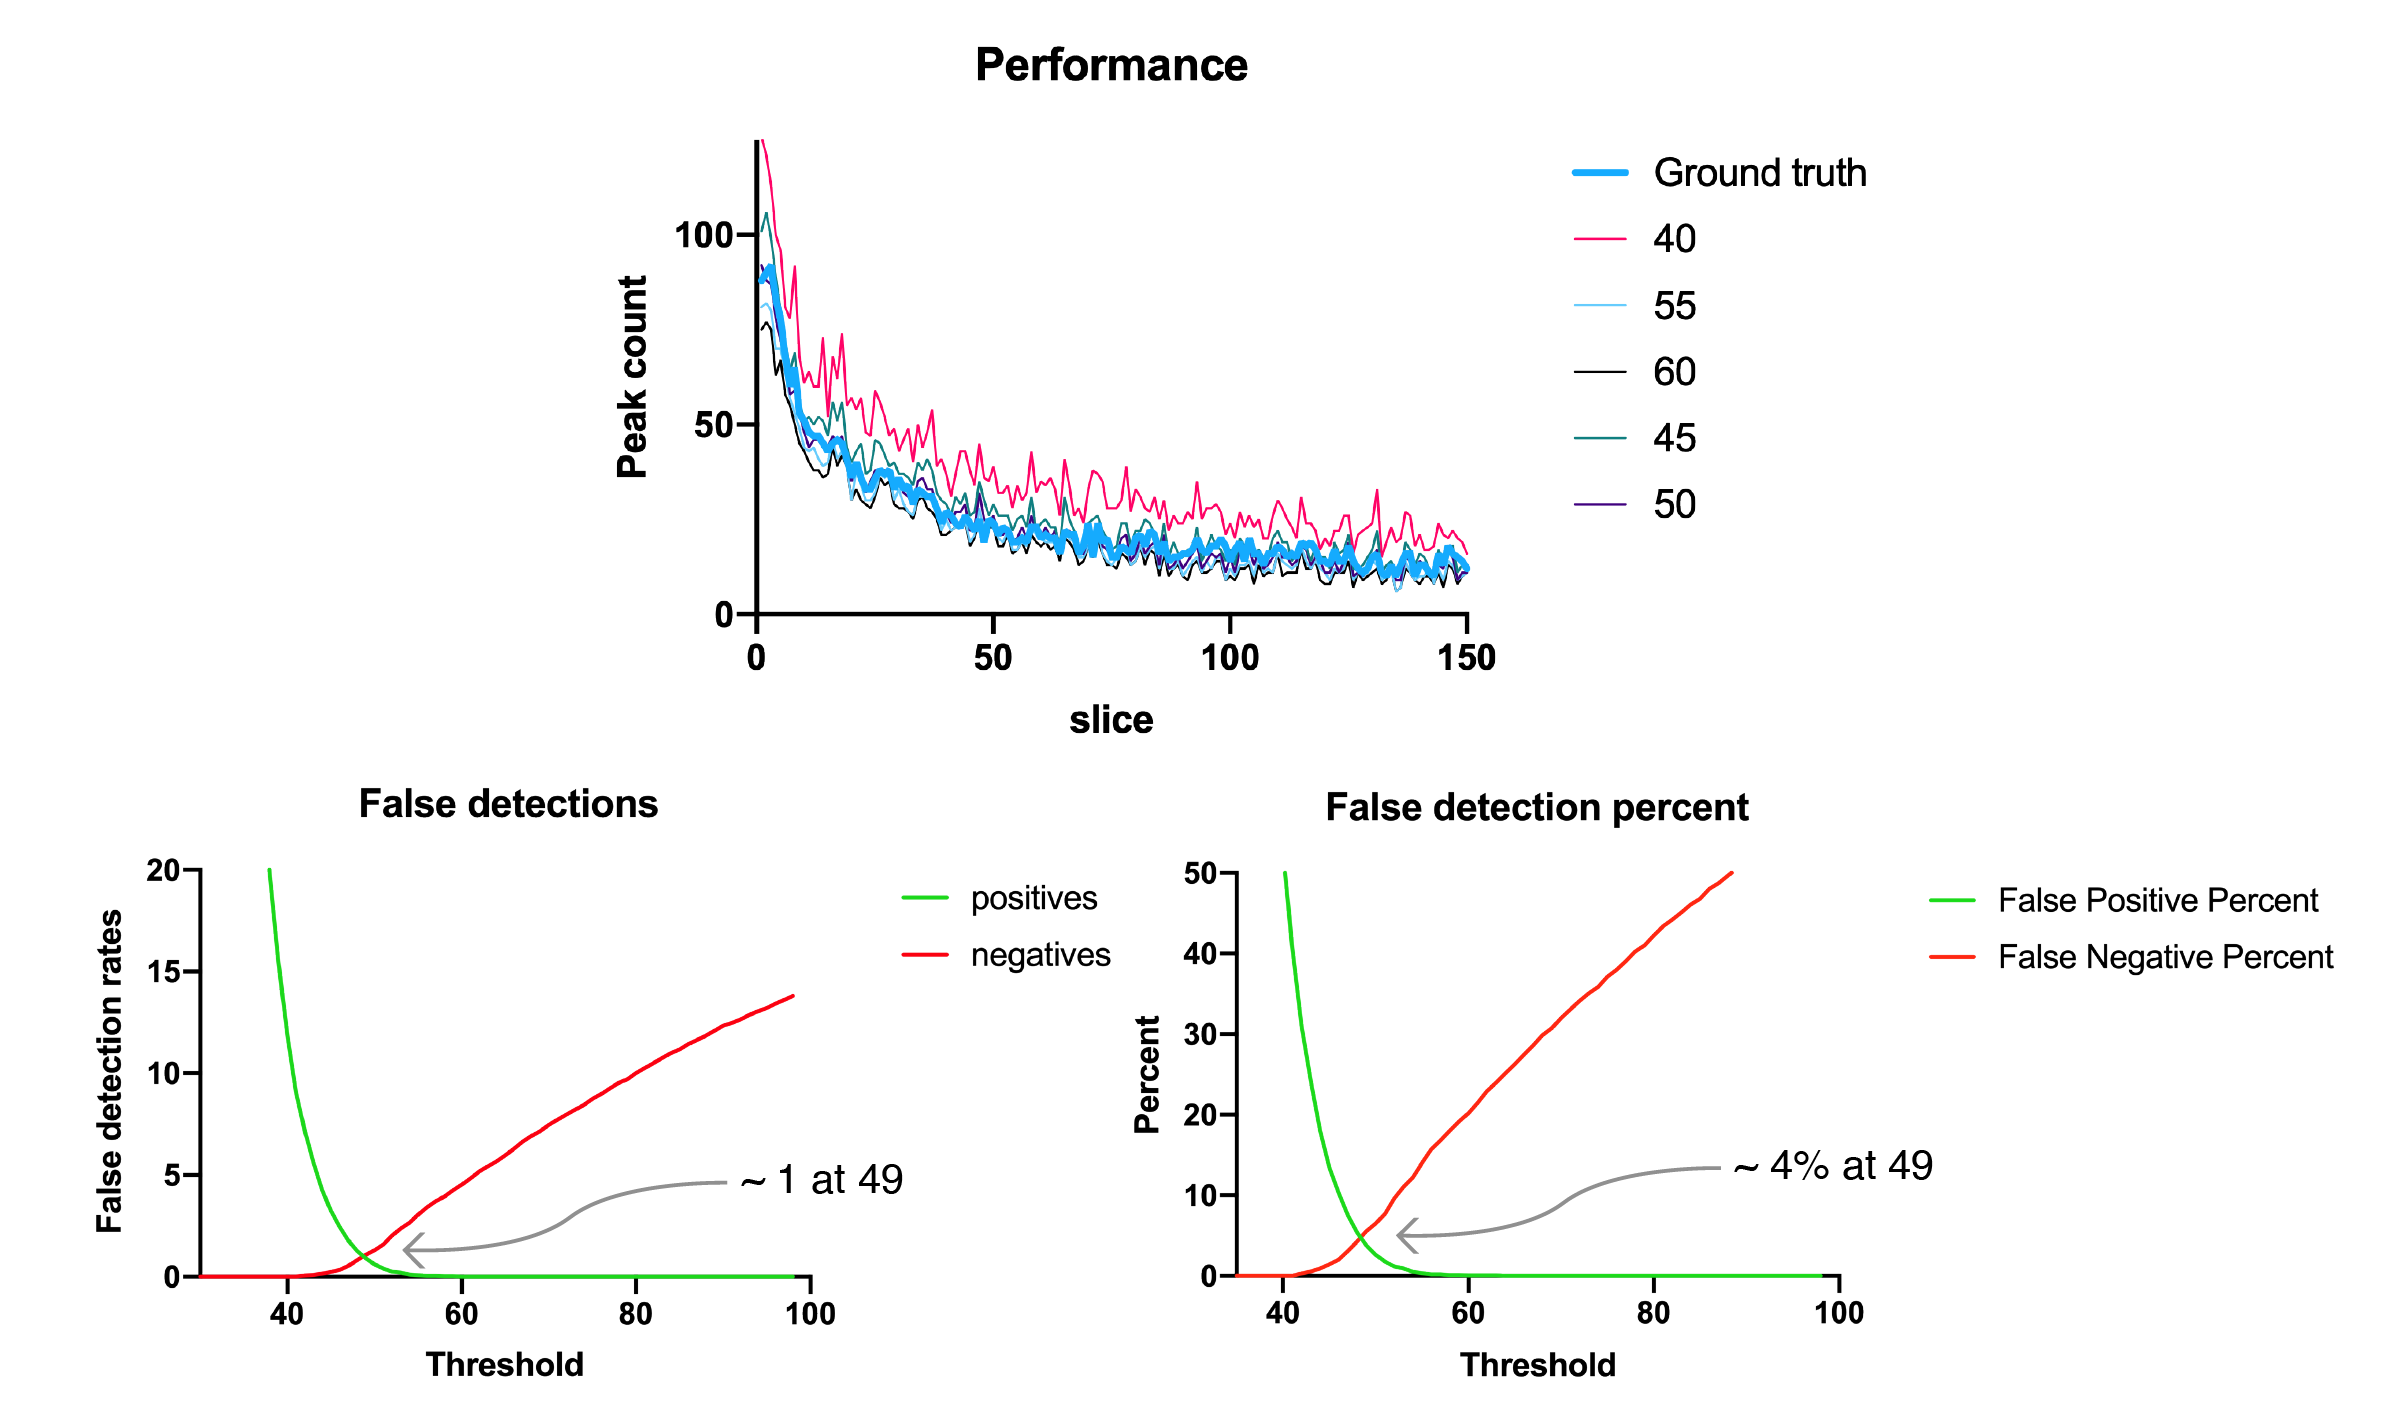
Having established the optimal DoG radius of 1.8, we can test different threshold values and determine which is best for peak detection. To do this we have determined the ground truth peak count for the video from which our example image was taken by manually counting. Displayed on the top are the peak counts per frame for different thresholds compared to ground truth. On the bottom is the mean number of false positives (green) and negatives (red) in each frame as a function of threshold value in raw numbers and percent of total peaks.
Groovy scripts
DoG filter op script:
#@ Img image
#@ double radius
#@OUTPUT Img output
#@ ImageJ ij

final double smaller = radius / Math.sqrt( 2 ) * 1.1
final double bigger = radius / Math.sqrt( 2 ) * 0.9

output = ij.op().run("dog", image, smaller, bigger)
Generate an output table of x profiles for a range of DoG radii given starting and ending x and y coordinates. For this to work properly please first convert your image to 32-bit using Image>Type>32-bit, save and reopen that image before performing this test:
#@ Img image
#@ ImageJ ij
#@ Integer Y
#@ Integer Xstart
#@ Integer Xend

#@OUTPUT MarsTable table

import de.mpg.biochem.mars.table.*
import org.scijava.table.*

table = new MarsTable("Dog Profiles")

def posCol = new DoubleColumn("Position")
def colRaw = new DoubleColumn("Raw")

rawra = image.randomAccess()
//Position , Dimension
//y
rawra.setPosition(Y,1)

for (def x=Xstart; x<=Xend; x++) {
	posCol.add(x as double)

	//Position , Dimension
	//x
	rawra.setPosition(x,0)

	colRaw.add(rawra.get().getRealDouble())
}

table.add(posCol)
table.add(colRaw)

//Now let's calculate it for different dog images...
//for (double radius = 1.0d; radius < 10.0d; radius++) {
for (double radius = 1.2d; radius < 3.0d; radius+= 0.2d) {

	double sigma1 = radius / Math.sqrt( 2 ) * 0.9d
	double sigma2 = radius / Math.sqrt( 2 ) * 1.1d

	def dog = ij.op().run("dog", image, sigma2, sigma1)
	def dogra = dog.randomAccess()
	dogra.setPosition(Y,1)

	def colDog = new DoubleColumn("Dog " + radius)

	for (def x=Xstart; x<=Xend; x++) {
		//Position , Dimension
		//x
		dogra.setPosition(x,0)
		colDog.add(dogra.get().getRealDouble())
	}
	table.add(colDog)
}
Generate a strip of different images for different DoG radii given an input image with a single peak:
#@ Img image
#@output Img profileSeries
#@ ImageJ ij

import net.imglib2.RandomAccessibleInterval
import net.imglib2.type.numeric.real.FloatType
import net.imglib2.interpolation.randomaccess.NLinearInterpolatorFactory
import net.imglib2.FinalInterval

w = image.dimension(0)
h = image.dimension(1)

profileSeries = ij.op().run("create.img", [w * 10, h, 1], new FloatType())
proRA = profileSeries.randomAccess()

//ij.op().create().img(FinalInterval.createMinSize(0, 0, w * 10, h), new FloatType())

int X0 = 0

//Now let's calculate it for different dog images...
//for (double radius = 1.0d; radius < 10.0d; radius++) {
for (double radius = 1.2d; radius < 3.0d; radius+= 0.2d) {

	double sigma1 = radius / Math.sqrt( 2 ) * 0.9d
	double sigma2 = radius / Math.sqrt( 2 ) * 1.1d

	def dog = ij.op().run("dog", image, sigma2, sigma1)
	def dogra = dog.randomAccess()

	for (x = 0; x < w; x++) {
		for (y = 0; y < h; y++) {
			//Position , Dimension
			//x
			dogra.setPosition(x, 0)
			//y
			dogra.setPosition(y, 1)

			proRA.setPosition(x + X0, 0)
			proRA.setPosition(y, 1)

			proRA.get().set(dogra.get())
		}
	}
	X0 += w
}
Generate peak count output for a range of different thresholds and put them into a single output table.
#@ ImagePlus image
#@OUTPUT MarsTable peaksVsThreshold
#@ ImageJ ij

import de.mpg.biochem.mars.table.*
import de.mpg.biochem.mars.ImageProcessing.commands.*

peaksVsThreshold = new MarsTable("Peak Count vs Threshold")

boolean sliceColAdded = false

for (double threshold = 20.0d; threshold < 100.0d; threshold++) {
     println("Running threshold " + threshold)
	//Make an instance of the Command you want to run...
	PeakFinderCommand peakFinder = new PeakFinderCommand();

	//Populates @Parameters Services etc.. using the current context
	//which we get from the ImageJ input...
	peakFinder.setContext(ij.getContext())

	peakFinder.setImage(image)
	peakFinder.setUseROI(false)
	peakFinder.setX0(0)
	peakFinder.setY0(0)
	peakFinder.setWidth(1024)
	peakFinder.setHeight(1024)
	peakFinder.setUseDogFiler(true)
	peakFinder.setDogFilterRadius(2.0d)
	peakFinder.setThreshold(threshold)
	peakFinder.setMinimumDistance(4)
	peakFinder.setGeneratePeakCountTable(true)
	peakFinder.setGeneratePeakTable(false)
	peakFinder.setAddToRoiManager(false)
	peakFinder.setProcessAllSlices(true)
	peakFinder.setFitPeaks(false)
	peakFinder.setFitRadius(4)
	peakFinder.setMaxErrorFilter(true)
	peakFinder.setMaxErrorBaseline(5000)
	peakFinder.setMaxErrorHeight(5000)
	peakFinder.setMaxErrorX(1)
	peakFinder.setMaxErrorY(1)
	peakFinder.setMaxErrorSigma(1)
	peakFinder.setVerboseFitOutput(false)

	//Run the Command
	peakFinder.run();

	//Retrieve output from the command
	def peakCount = peakFinder.getPeakCountTable()

	if (!sliceColAdded) {
		def sliceCol = peakCount.get("slice")
		sliceCol.setHeader("slice")
		peaksVsThreshold.add(sliceCol)
		sliceColAdded = true
	}

	def col = peakCount.get("peaks")
	col.setHeader("" + threshold)
	peaksVsThreshold.add(col)
}
Given one input table with a ground truth “Peaks” column and the output for all thresholds from the script above, this script generates the mean false detection rate and percent false detections.
#@ MarsTable groundTruth
#@ MarsTable peaksVsThreshold
#@OUTPUT MarsTable outputTable

import de.mpg.biochem.mars.table.*
import org.scijava.table.*

outputTable = new MarsTable("Performance")

DoubleColumn threshold = new DoubleColumn("threshold")
DoubleColumn positives = new DoubleColumn("positives")
DoubleColumn negatives = new DoubleColumn("negatives")
DoubleColumn positivesPercent = new DoubleColumn("positives percent")
DoubleColumn negativesPercent = new DoubleColumn("negatives percent")

def columnCount = peaksVsThreshold.getColumnCount() - 1
def rowCount = groundTruth.getRowCount()
def thresholdValue = 20.0d
for (int col = 1; col < columnCount; col++) {
	double posSum = 0.0d
	double negSum = 0.0d

	double posPerSum = 0.0d
	double negPerSum = 0.0d

	for (int row = 0; row < rowCount; row++) {
		double diff = peaksVsThreshold.getValue(col, row) - groundTruth.get("Peaks", row)
		if (diff > 0) {
			posSum += diff
			posPerSum += diff / groundTruth.get("Peaks", row)
		}
		if (diff < 0) {
			negSum += Math.abs(diff)
			negPerSum += Math.abs(diff) / groundTruth.get("Peaks", row)
		}
	}

	threshold.add(thresholdValue)
	positives.add(posSum / (double)rowCount)
	negatives.add(negSum / (double)rowCount)

	positivesPercent.add(posPerSum / (double)rowCount)
	negativesPercent.add(negPerSum / (double)rowCount)

	thresholdValue += 1.0d
}

outputTable.add(threshold)
outputTable.add(positives)
outputTable.add(positivesPercent)
outputTable.add(negatives)
outputTable.add(negativesPercent)