Object Tracker
This command is used to identify unspecified objects in microscopic images and track their position through frames. Classification by segmentation allows for the identification of these objects and their center of mass is tracked as the position of the object.
Note: the Object Tracker command computationally rather expensive scaling up with the otsu radius that is applied. Hence, it is advised to run the command either with very small videos or when using larger videos to rund this command on a computing cluster.
How does object identification work?
Segmentation
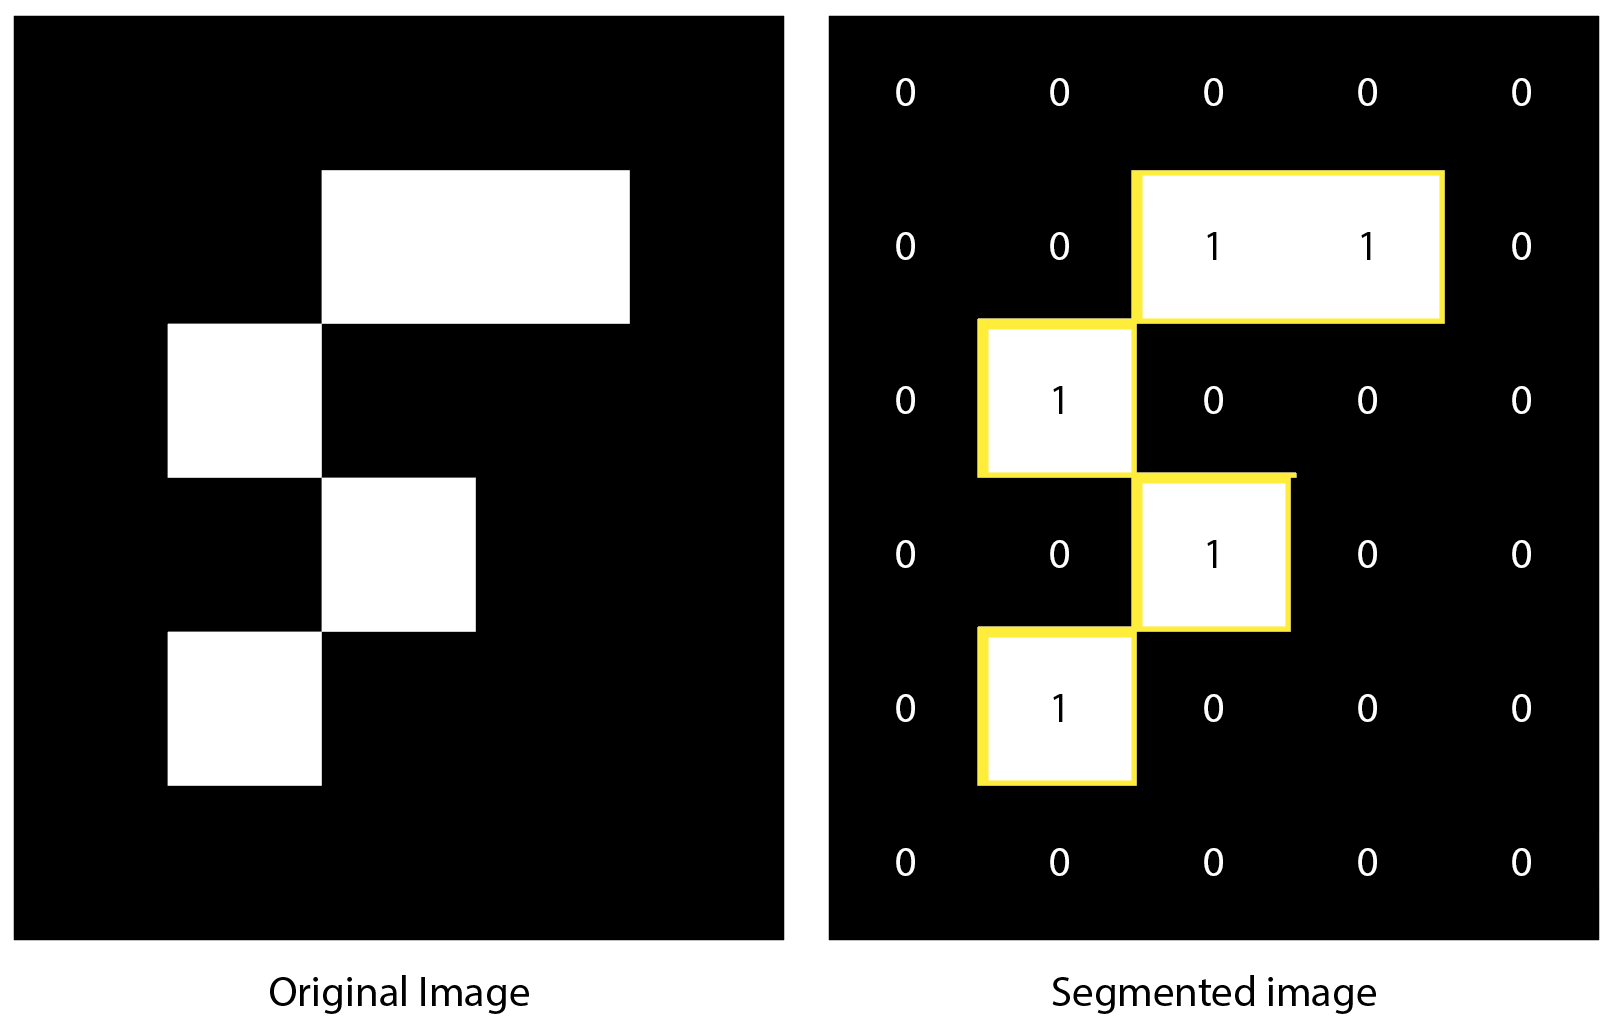
Objects are identified in the image through segmentation. Image segmentation is the process of partitioning an image into segments (sets of pixels) in order to simplify. In the case of the Object Tracker tool the image is segmented based on pixel intensity values according to a set threshold. In the example below you see a segmentation of an artificial example image displaying a curved white feature against a black background. Through segmentation this object was identified as the yellow-outlined area.
Thresholding
To distinguish between objects setting the threshold value correctly is key. Microscopy images tend to be noisy making this process less straight-forward than shown in the example above. Apart from that, artefacts may arise such as illumination issues and scattering resulting in different intensity observations in different parts of the image. Therefore the Object Tracker command uses a local threshold defined by the Otsu method. The threshold is determined locally for each pixel and its surroundings according to this method. This allows for good segmentation results in images where intensities might not be homogenous throughout the image.
Object formation
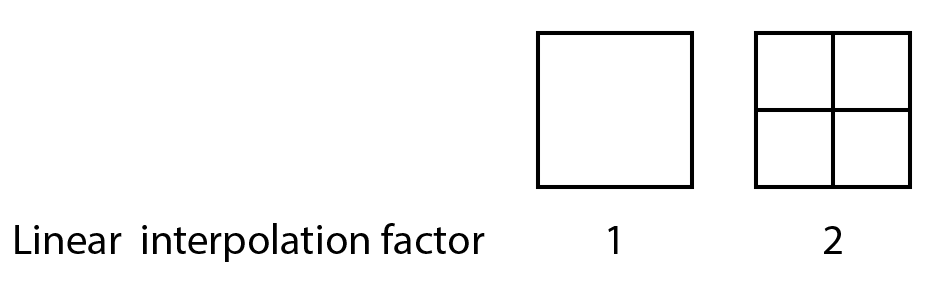
After the segmentation procedure has been executed connected component analysis connects the subsets that are found to form a larger object. The ‘minimum distance between object centers’ parameter in the Object Tracker command allows the user to set how many pixels should be between two different objects. Smoother fits can be obtained using the ‘linear interpolation factor’ in the command. When for example setting this factor to 2, each pixel will be subdivided into 2^2=4 subpixels for which then thresholding takes place.
Example data
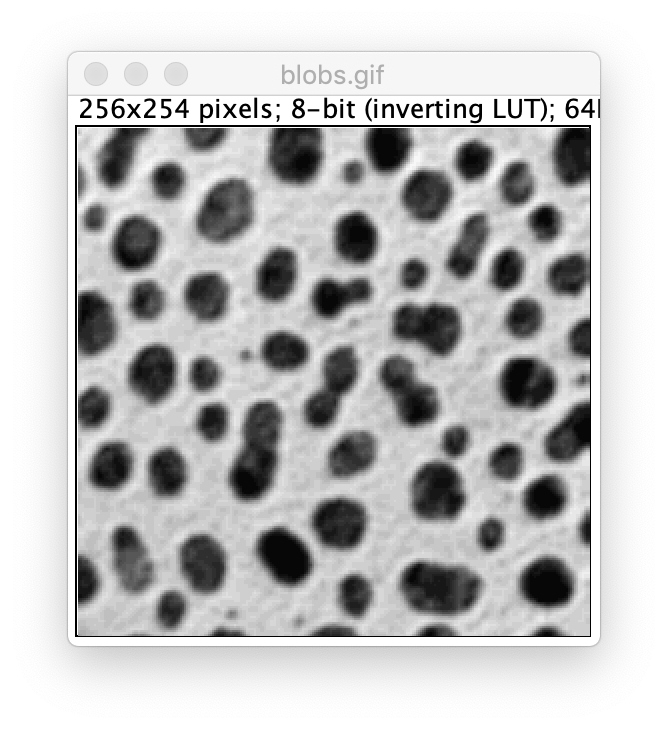
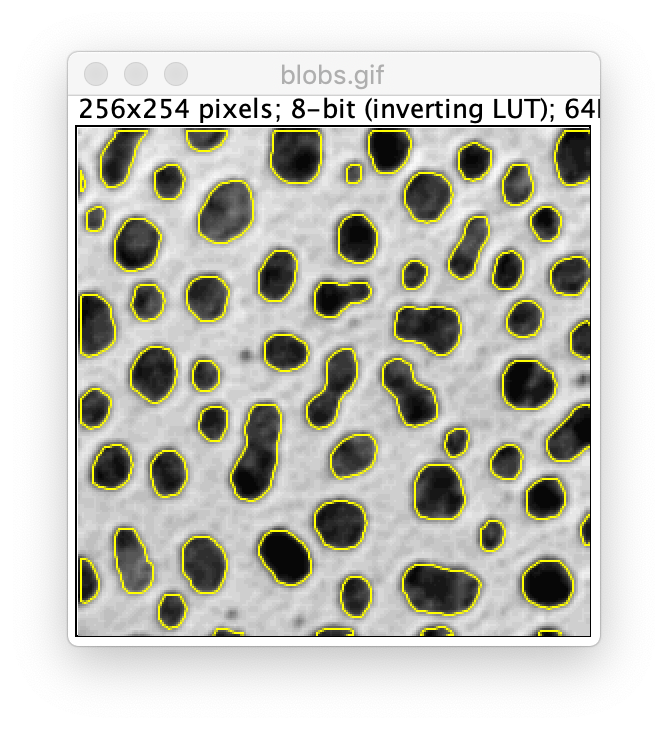
As an example the Object Tracker settings can be applied on a standard Fiji sample. Open the ‘blobs’ image going through File>Open Samples>Blobs. Now apply the settings as shown below to identify the blobs as objects.
Input
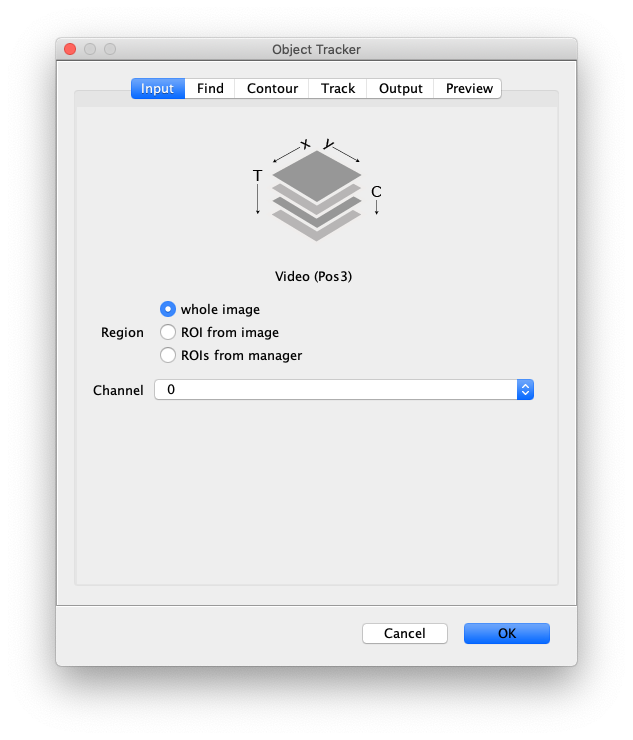
- Image - The active image selected will be used by the DNA Finder. The name of this image will be displayed below the image stack in the dialog.
- Region - Apply the tool to either the ‘whole image’, an ‘ROI from image’ or ‘ROIs from manager’. To select multiple ROIs to be analyzed use the ROI manager in Fiji. Instructions on ROI tools can be found in this video.
- Channel - Select which channel to analyze in case a video with multiple channels is provided as input.
Find
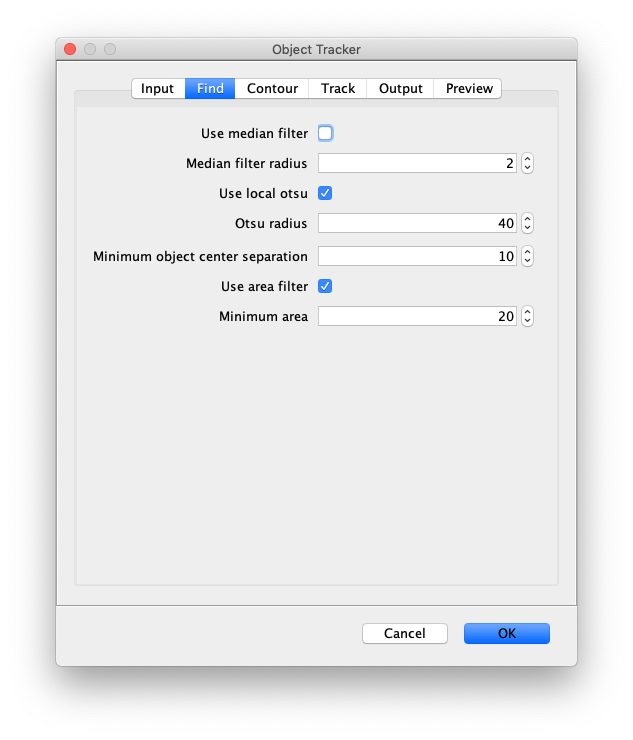
- Use median filter - Enable a median filter.
- Median filter radius - Set the radius of the applied median filter.
- Use local otsu - Tick this to use the local otsu radius.
- Otsu radius - Specifies the surrounding radius in pixels that are used to calculate the local otsu threshold on which segmentation will be based. Selecting a too small region might result in the identification of noise as objects, a too large region might overlook objects.
- Minimum object center separation - Specifies how much pixels need to be present between objects. Two objects closer to each other than this parameter will be merged into one object.
- Use area filter - Tick in case objects should be filtered to match a certain threshold for the object area.
- Minimum area - Threshold value for the area filter. Allows the user to exclude objects identified that are too small to be relevant for the analysis.
Contour
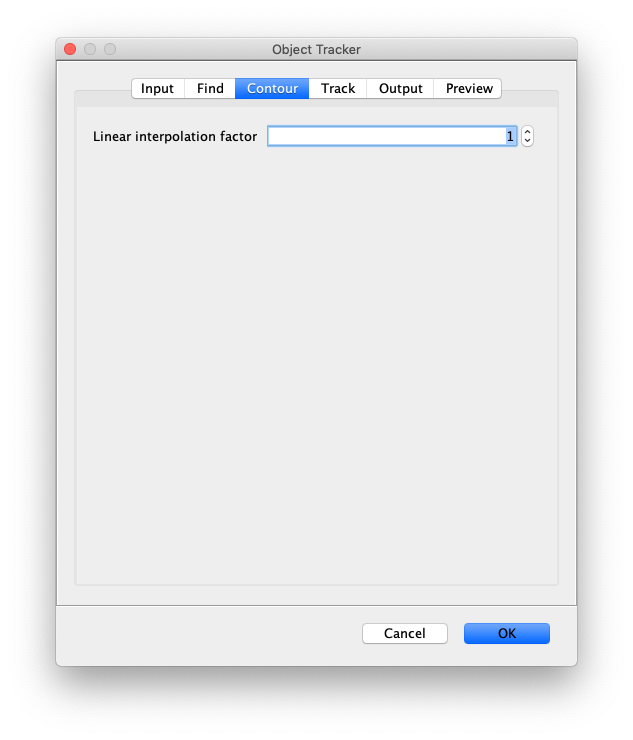
- Linear interpolation factor - Set to >1 for smoother fit results using linear interpolation.
Track
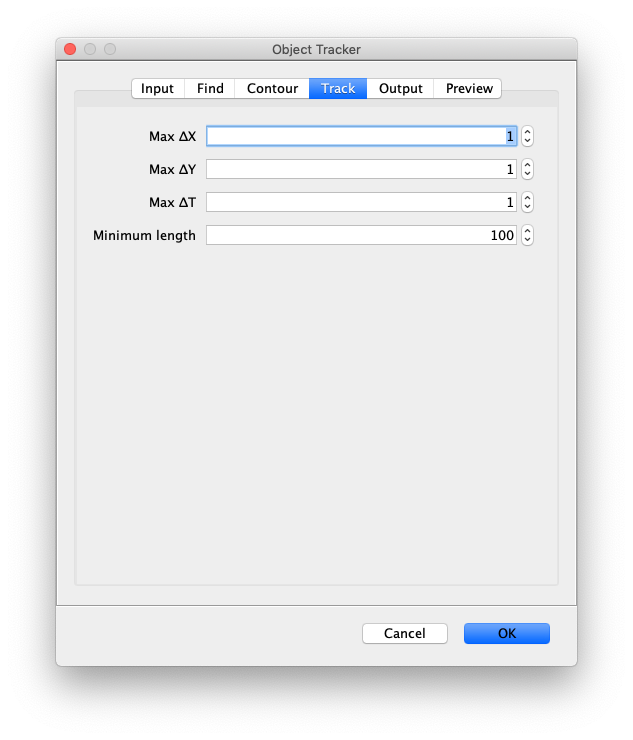
- Max ∆X - The threshold difference between the X position of two object locations below which they are still allowed to be linked.
- Max ∆Y - The threshold difference between the Y position of two object locations below which they are still allowed to be linked.
- Max ∆T - The number of frames (T) into the future to search for a possible link. This parameter is very important to ensure tracking is robust against single frames where peaks are not detected.
- Minimum length - All tracks with fewer than this number of slices will be rejected and removed from the Molecule Archive. Frequently single-molecule experiments have many short tracks resulting from molecules appearing for only a couple frames then going away. This removes all these events.
Output
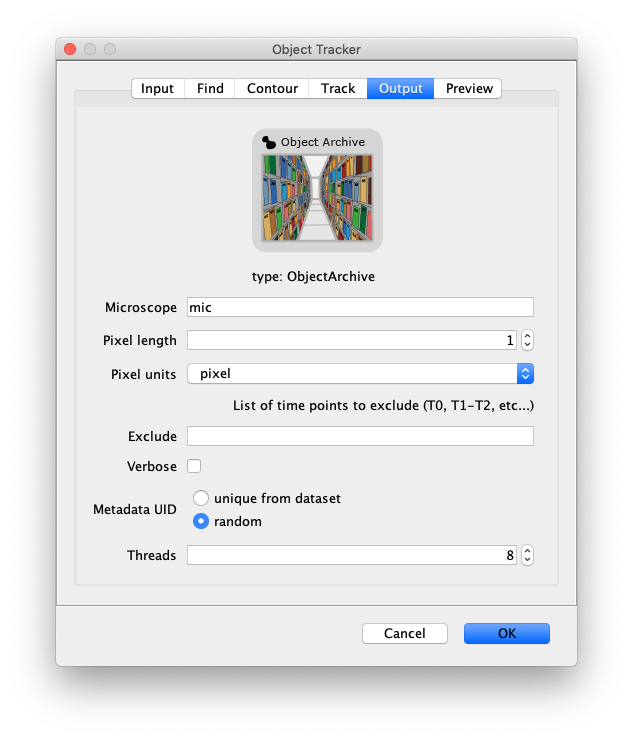
- Microscope - The name of the microscope used for data collection. This name is included in the metadata record.
- Pixel length - Length of a pixel in the microscope system used for data collection.
- Pixel units - Units of the provided pixel length.
- Exclude - List timepoints to exclude from the tracking process. This allows the user to exclude frames from the analysis without having to delete them from the dataset irreversibly.
- Verbose - If checked all fit parameters are included in the output (baseline, height, x, y, sigma, R2). If unchecked only the position, slice, intensity columns will be included in the output. Verbose output can be used to optimise the R-squared minimum, or for calculations based on peak properties.
- Metadata UID - Generate a metadata UID based on the metadata UID supplied in the image metadata or generate a new one randomly.
- Thread count - Determines how much computing power of your computer will be devoted to this calculation. A higher thread count decreases computing time.
Preview
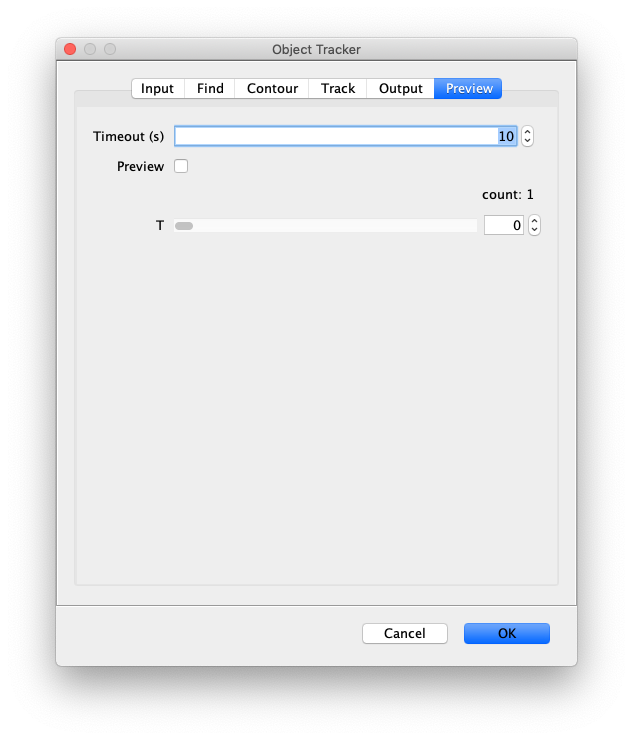
- Preview timeout(s) - Maximum computing time allowed to calculate the preview of the settings. If the video is too large or the settings are way off the computing time could become rather significant causing a crash of the system. Setting this limit prevents that.
- Preview - Shows a contour of the identified objects with the current settings.
- T - Select the time point (T) to show peak finding results on in the video.
Results
- Object Archive - An Object Archive with individual records for all tracked molecules as well as metadata information.
How to run this Command from a groovy script
#@ Dataset dataset
#@ ImageJ ij
#@OUTPUT ObjectArchive archive

import de.mpg.biochem.mars.object.*
import de.mpg.biochem.mars.object.commands.*

//Make an instance of the Command you want to run.
ObjectTrackerCommand objectTracker = new ObjectTrackerCommand()

//Populates @Parameters Services etc. using the current context
//which we get from the ImageJ input.
objectTracker.setContext(ij.getContext())

objectTracker.setDataset(dataset)
objectTracker.setImagePlus(true)
objectTracker.setUseROI(false)
objectTracker.setChannel(0)
objectTracker.setUseLocalOtsu(False)
objectTracker.setLocalOtsuRadius(20)
objectTracker.setMinimumDistance(10)
objectTracker.setInterpolationFactor(1)
objectTracker.setUseAreaFilter(false)
objectTracker.setMinimumArea(30)
objectTracker.setMaxDifferenceX(5)
objectTracker.setMaxDifferenceY(5)
objectTracker.setMaxDifferenceT(5)
objectTracker.setMinimumTrackLength(10)
objectTracker.setVerboseOutput(false)
objectTracker.setMicroscope("Microscope")
objectTracker.setPixelLength(1)
objectTracker.setPixelUnits("pixel")
objectTracker.setExcludedTimePointsList("0-100, 154, 234-400")

//Run the Command
objectTracker.run();

//Retrieve output from the command
archive = objectTracker.getArchive()

//If run in Fiji the archive will appear,
//but you can continue to use it for further processing
//Using the retrieval command above.